


An analyst explained how Bitcoin’s availability for trading has quietly declined during the asset’s recent consolidation phase.
Bitcoin May Be In A Good Position To Set New All-Time Highs
In a new post on X, analyst Willy Woo discusses the recent trend in the Bitcoin inventory sitting on centralized exchange platforms.
Related Reading
The chart below shows how the spot and paper BTC reserves have changed over the past few years.

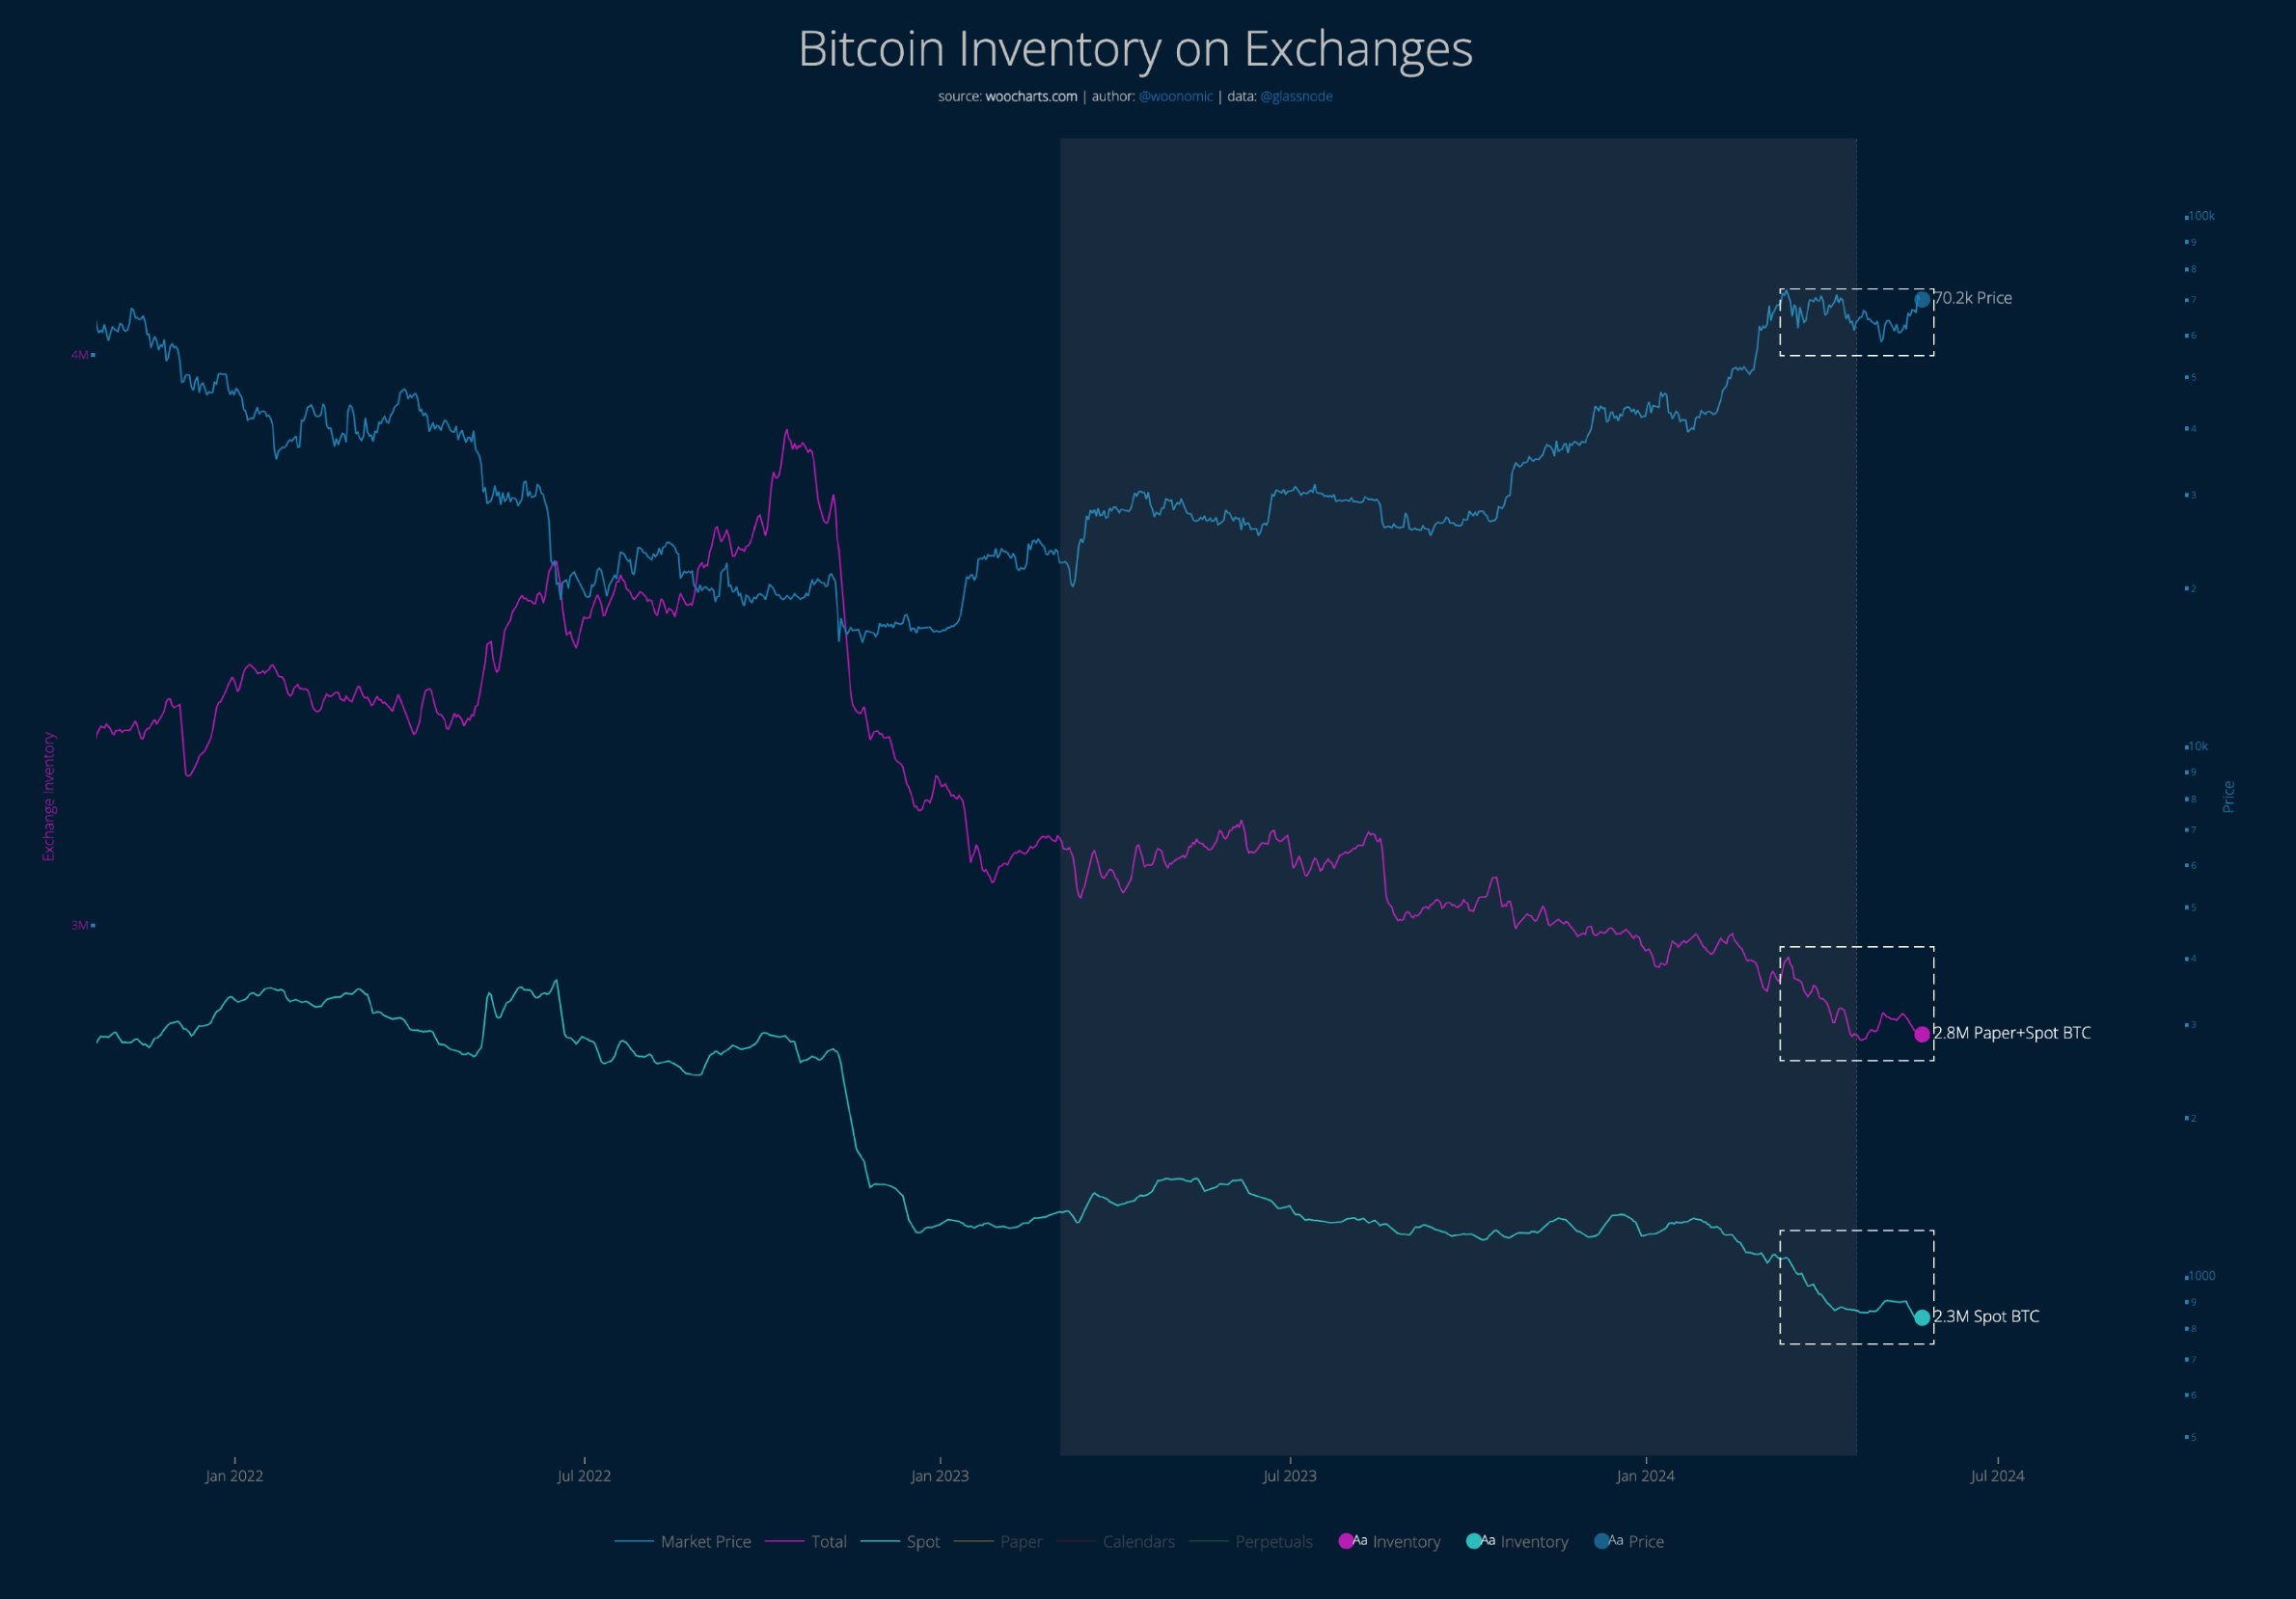
As the graph shows, the Bitcoin sitting in spot wallets has been declining over the last couple of months. The total amount of such BTC in the custody of central entities has now dropped to just 2.3 million.
It’s also apparent that the total sum of the spot and “paper” BTC (highlighted in purple) has declined at the same time. Paper BTC here refers to derivatives products related to cryptocurrency that don’t actually require investors to own the asset.
Thus, given that the combined sum of the exchange inventory has gone down for the cryptocurrency, it would appear that the decrease in the spot BTC isn’t because paper BTC has replaced it.
Generally, the supply of exchanges is considered part of the Bitcoin supply, which is “available” for trading. As such, due to how supply-demand dynamics work, less of this available supply may be a constructive sign for the cryptocurrency.
From the graph, it’s visible that this decline in the exchange inventory has come during a period where the price of the cryptocurrency has struggled after setting a new all-time high (ATH). As Woo notes,
While everyone was freaking out that Bitcoin price was not rising the last 2 months, available BTC was quietly being scooped up, and importantly without paper BTC printed in its place.
Thus, the fact that the available supply has gone down during such a period could be a bullish sign for the coin. “It’s only a matter of time before BTC squeezes past all-time highs,” says the analyst.
Related Reading
In another X post, Woo also discussed how capital inflows into Bitcoin have just started to pick up again after registering a steep drop earlier.

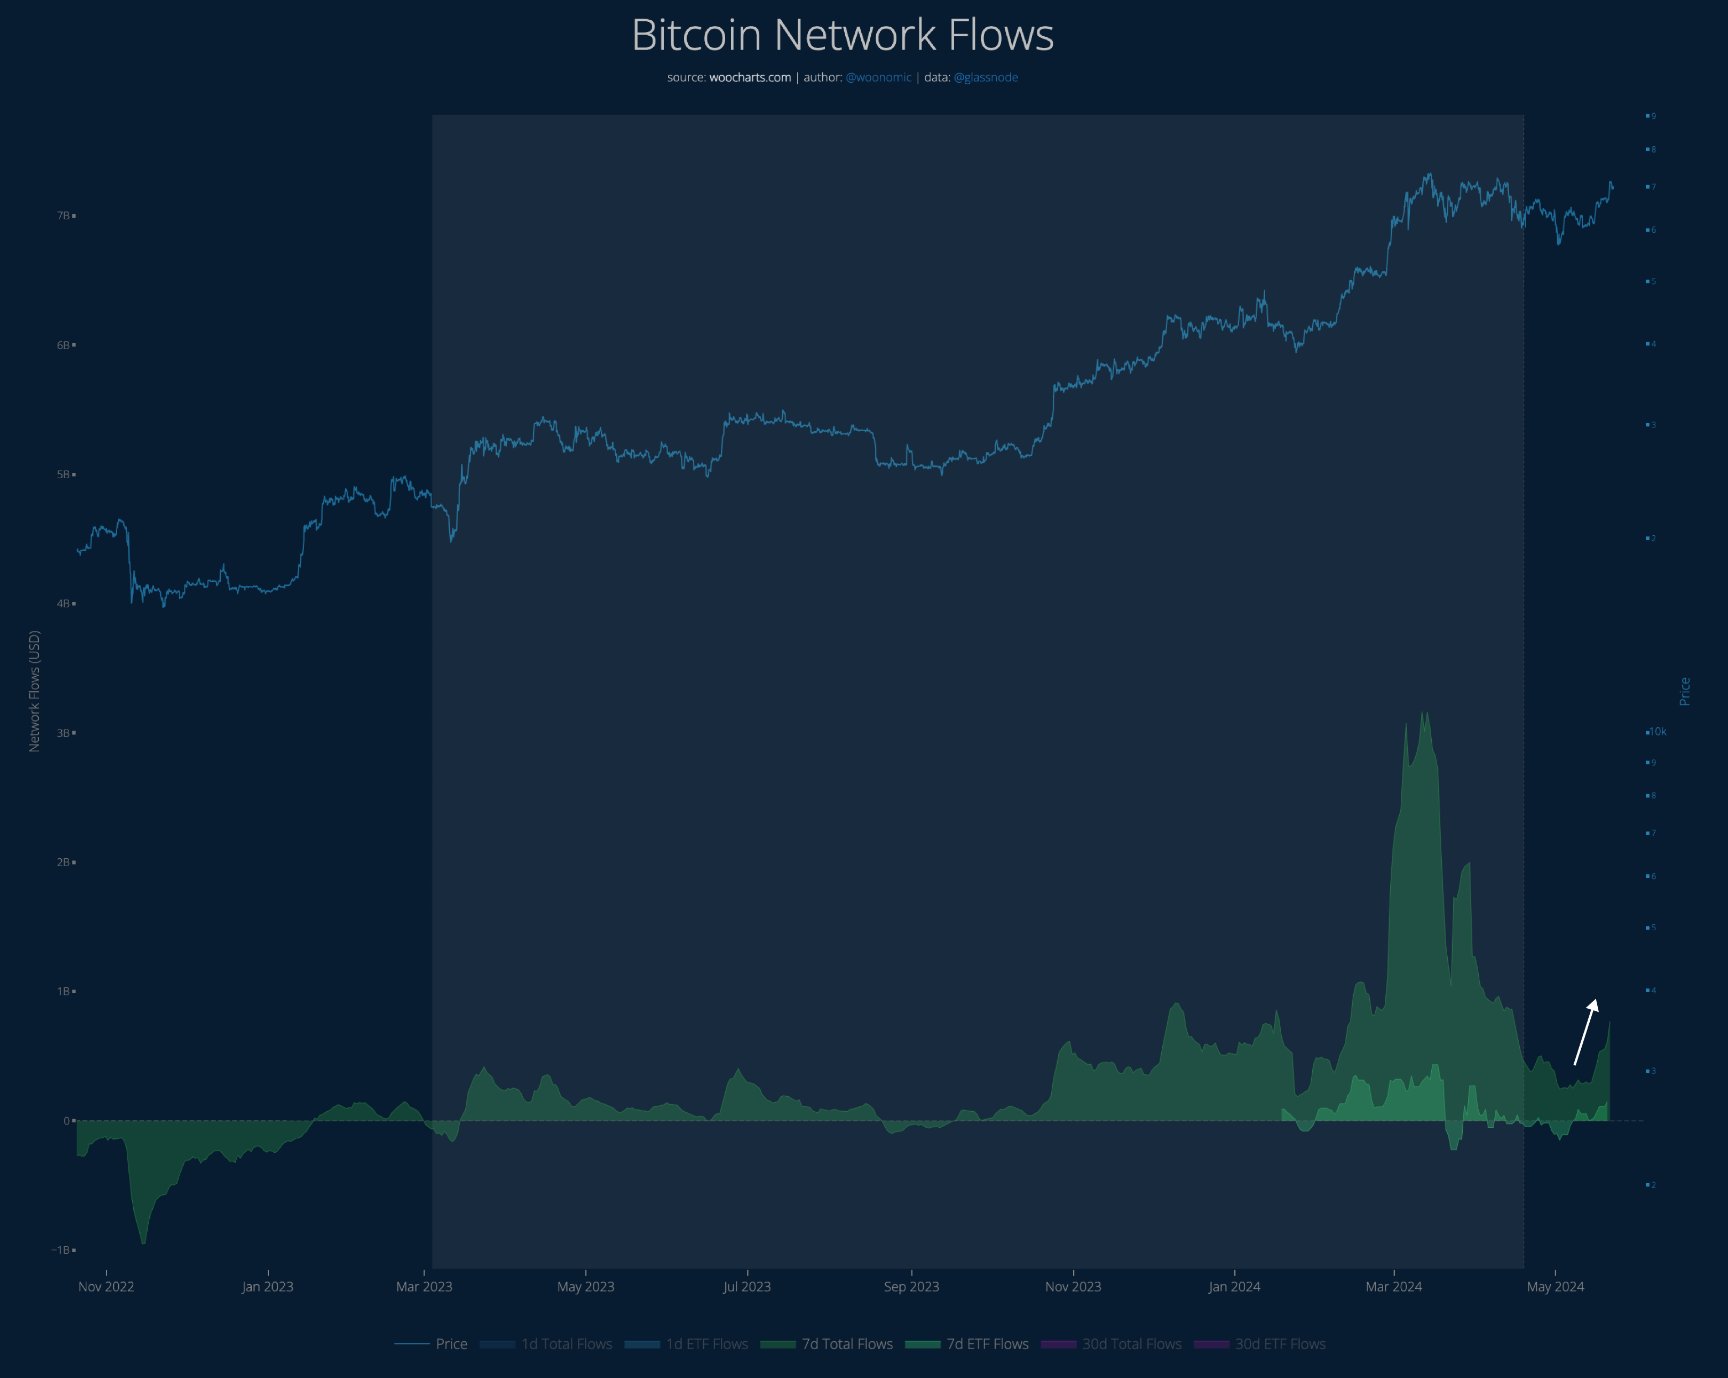
As the chart shows, network inflows spiked alongside the all-time high, but they observed a major slowdown in the consolidation that followed.
The inflows from spot exchange-traded funds (ETFs), highlighted in light green, also disappeared earlier, but they have now made a comeback alongside these fresh capital inflows.
BTC Price
Bitcoin had recovered as high as $71,000 earlier but appears to have slipped off over the last few days as it has now returned below the $68,000 level.

Featured image from Shutterstock.com, woocharts.com, chart from TradingView.com
Source: NewsBTC.com


 On Verge Of Major Surge, Analyst Says")
