


Data from a Bitcoin pricing model based on an on-chain indicator suggests that $77,600 may be the level where the asset will see its next peak.
Bitcoin MVRV Pricing Bands Could Provide Hints About What’s Next
In a new post on X, analyst Ali discussed what the Market Value to Realized Value (MVRV) Pricing Bands model could suggest about the cryptocurrency’s future.
The MVRV ratio is a popular on-chain indicator that compares the Bitcoin market cap and realized cap. The former is just the total valuation of the asset at the current spot price, while the latter is a model that calculates the asset’s cap by assuming the “true” value of any coin in circulation is the price at which it was last transferred on the blockchain.
Related Reading
The previous transfer of any coin on the network was likely the last time it changed hands, and thus, the price at that time would be its current cost basis. As such, the realized cap keeps track of the sum of the cost basis of every investor in the market.
Therefore, the MVRV ratio tells us how the value the investors hold (the market cap) compares against the value they put in (the realized cap).
Based on this indicator, the on-chain analytics firm Glassnode has developed a pricing bands model. Below is a chart showing what these pricing bands look like.

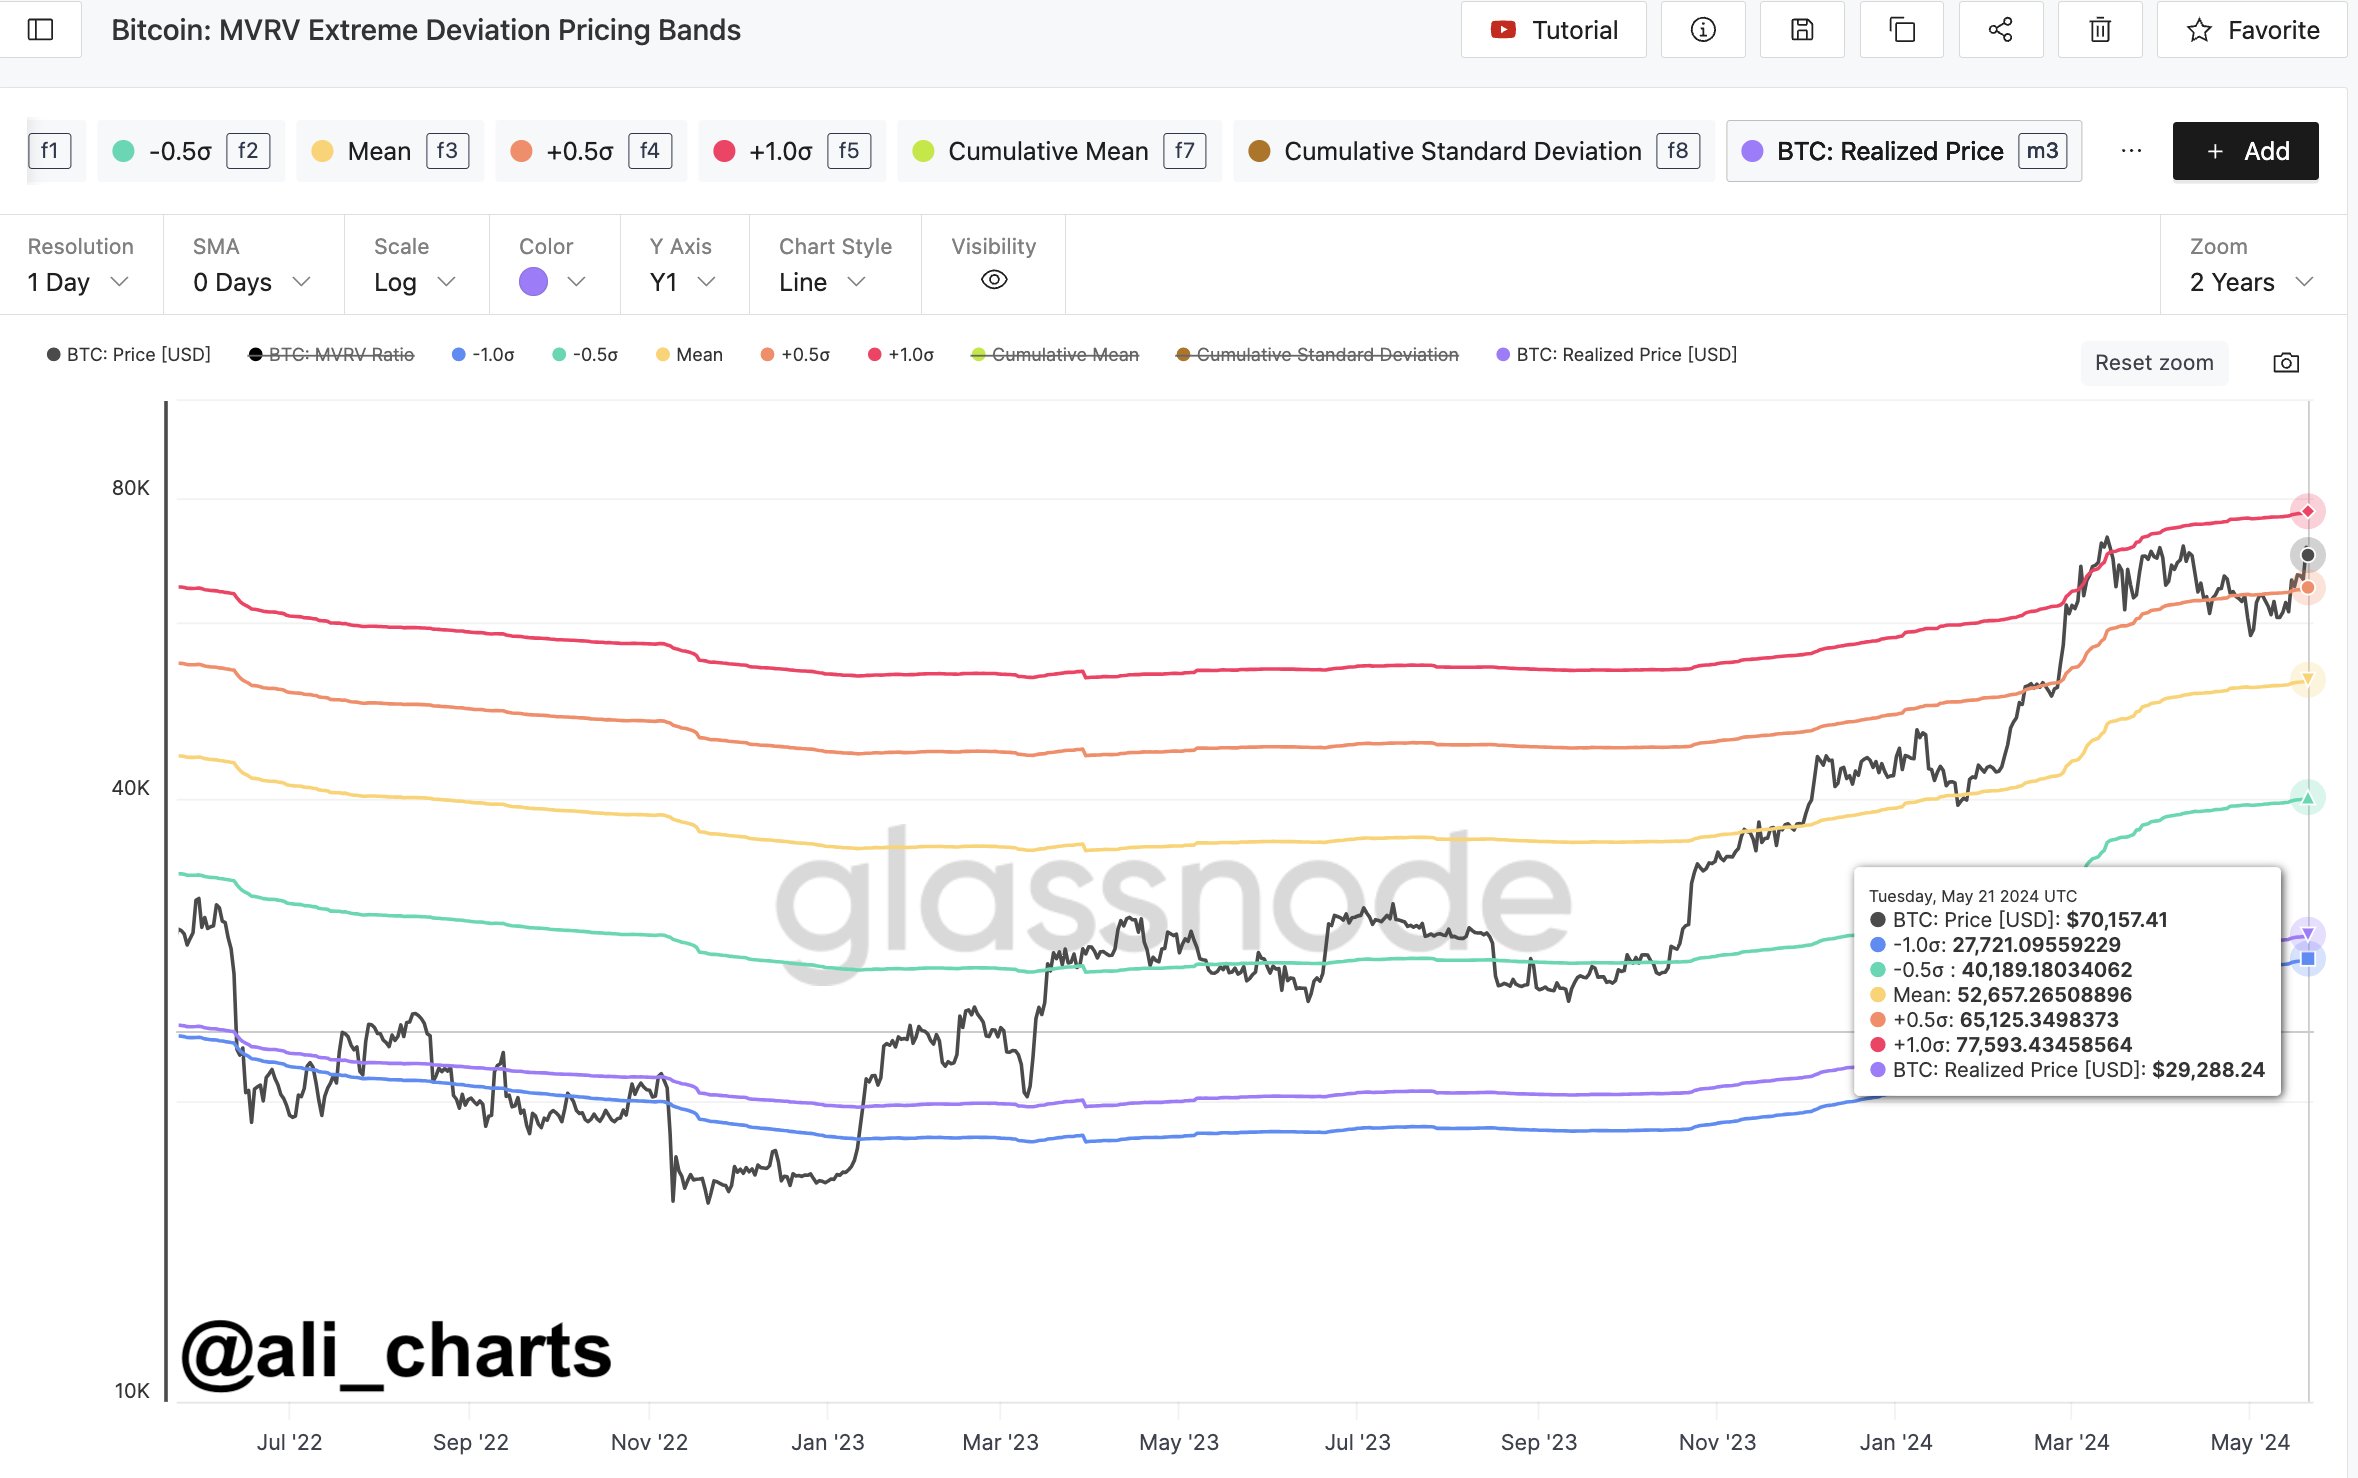
The pricing bands in this model represent levels corresponding to a specific deviation from the mean for the MVRV ratio. From the chart, it’s visible that the cryptocurrency is currently above the price level, corresponding to a +0.5 standard deviation (SD) from the mean for the indicator.
More specifically, the price level around $65,100 would be where the MVRV ratio would be +0.5 SD above its mean. The next major pricing band in this model is +1 SD, which currently corresponds to around $77,600.
In the past, this level has been where at least local tops have been probable to form for BTC. As is visible in the graph, the rally top back in March also occurred when BTC broke this level.
“Based on the MVRV Pricing Bands, if Bitcoin continues to trade above $65,125, the next local BTC top before a brief correction could be around $77,593!” notes the analyst.
Related Reading
From the current spot price of the cryptocurrency, a potential rally to a new all-time high of $77,593 would mean an increase of more than 11% for the asset. It now remains to be seen how the asset’s price will develop from here and whether it will be able to maintain above the +0.5 SD MVRV level.
BTC Price
Since its sharp surge earlier, Bitcoin’s bullish momentum appears to have cooled off as the asset has fallen to sideways movement around the $69,700 mark.

Featured image from Kanchanara on Unsplash.com, Glassnode.com, chart from TradingView.com
Source: NewsBTC.com


