Bitcoin Price Prediction: Weekly and Daily Analysis
Bitcoin is testing a crucial weekly moving average near $105,000, while daily momentum shows tentative buying pressure returning. Traders are observing weekly closes to confirm whether the price maintains its bullish trend or moves lower.
Bitcoin Price Prediction: Weekly Trend and Key Moving Average
The weekly chart illustrates that Bitcoin has been trading near the 20-week moving average, currently at $105,000, which is an important level for reviewing the macro trend structure. The 20-week moving average is also an area that traders can utilize to evaluate possible medium-term price stability in their analysis.
Benjamin Cowen tweeted that BTC has returned over the 50-week simple moving average as the weekly close approaches. A weekly close above $105,000 could see a price where higher levels near $115,000–$120,000 can be explored, while multiple weekly closes below $105,000 may suggest re-balancing towards the $98,000–$100,000 support levels. Weekly behavior for BTC will be very important for possible positioning in the coming weeks.
After the last several weeks, we have begun to see lower highs form, meaning that BTC is showing a possible short-term weakening momentum of price action. Watching for price interaction with the 20-week moving average may provide a better view in understanding if the bullish structure remains intact or if consolidation may take place.
Volume near the 20-week moving average will additionally allow us to understand trader conviction. When traders are able to remain active in this area above the 20-week, the higher volume of activity is supportive of a continuation of the broad uptrend.
Don’t want to jinx it but BTC is back above the 50W SMA as we come into the weekly close pic.twitter.com/gdHYgEIsg9
— Benjamin Cowen (@intocryptoverse) November 9, 2025
Bitcoin Price Prediction: Daily Indicators Show Stabilization
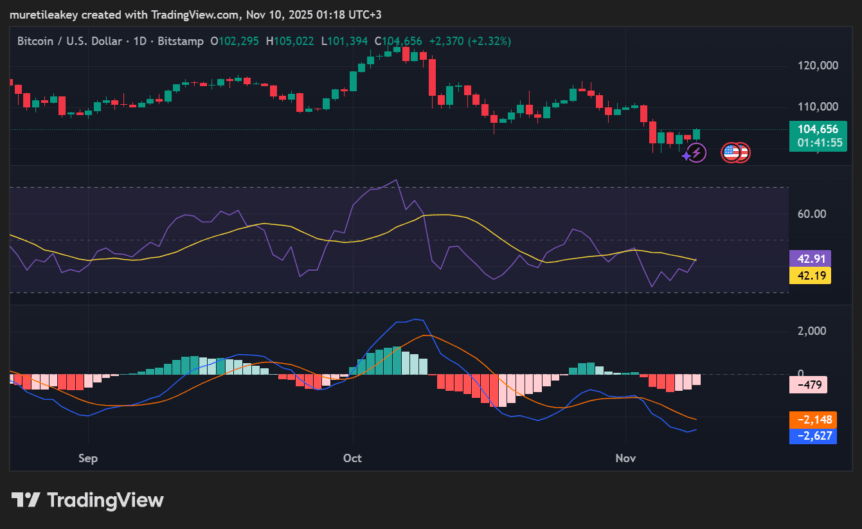
At the time of writing, BTC is trading at approximately $104,655 following an apparent recovery from previously selling pressure, as indicated in the daily chart. The RSI is at about 42.91, just under the middle ground of the neutral range, suggesting moderate momentum and possible buying interest has developed.
The MACD is still in negative territory, but the lower histogram bars indicate a diminishing bearish momentum. If buyers build upon their push, they could lead BTC to cross above to a surge to the $108,000–$110,000 range. The support zone comes in between $103,000–$105,000 and remains pivotal.
Price action in the near term will ultimately be dependent on daily close and volume action trading. Breaking down the support may lead price action lower to a possible retest of the $100,000 psychological level, while maintaining the zone may allow for further consolidation before resuming a bullish bias.
By default, the daily momentum is suggesting that sellers are decreasing in strength, although buyers have not fully regained full control, and traders will want to watch these indicators to inform their short-term style trading approach based on current market conditions.

Bitcoin Price Prediction: Market Sentiment and Commentary
Market commentary draws together both technical perspectives and macroeconomic perspectives. Robert Kiyosaki brought attention to longer-term targets: he suggested that BTC could be valued as much as $250,000 in 2026. While Kiyosaki’s message is a factor of sentiment for crypto traders, sentiment drives much of the trading behavior.
Merlijn The Trader shared that the corporation Shell will now be accepting BTC payments in South Africa, demonstrating an example of continued corporate acceptance of cryptocurrency. The larger fiscal behaviors and social sentiment can also continue to spur liquidity and behavior for short-term trading.
Benjamin Cowen’s recognition of the 50-week SMA was also presented, which is a way to frame trader interest in weekly closes. Investors are weighing the technical support with updated benefits of adoption in the real world to consider expectations for future trading.
It is important to recognize that market narratives continue to include surveys of potential government action or liquidity events that could impact the marketplace. Such action could be an impetus for market movement, even short-term
Combining technical analysis for entry and exit diagnosis in the current market, with observations of sentiment, will help traders plan for future entry/exit levels.


