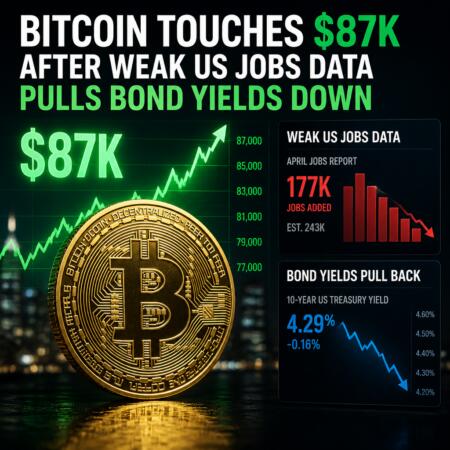
Bitcoin extended its advance into the US holiday weekend, setting fresh July highs as buyers pressed through a key technical level near the 200-week moving average. The move also played out alongside strength in global equities, as expectations for Federal Reserve action appeared to soften after weaker US jobs data.
On TradingView, BTC/USD reached $62,295 on Bitstamp—its highest level since June 24—highlighting renewed focus on whether the latest breakout can be sustained through the next weekly close.
Key takeaways
- Bitcoin pushed to $62,295 on Bitstamp, marking a fresh July high and the strongest print since June 24.
- Traders are watching the 200-week simple moving average, cited around $62,652, as a pivotal level for weekly structure.
- Price action is approaching a broader “strong resistance area” near $62,000–$62,500.
- Weak US nonfarm payrolls helped lift risk assets, while CME Group’s FedWatch tool pointed to roughly even odds of a September pause versus a hike.
BTC tests a major technical line near the 200-week SMA
The latest rally has brought Bitcoin back to levels closely tracked by chart analysts. According to TradingView data referenced by market observers, BTC/USD hit $62,295 on Bitstamp, extending gains during the Independence Day holiday period when US markets were closed.
For many traders, the near-term question is not simply whether Bitcoin can trade higher, but whether it can hold its momentum around the 200-week moving average. One commonly cited reference point comes from Daan Crypto Trades, who highlighted that the 200-week simple moving average is currently around $62,652, and that it may be important for the weekly candle close.
“It is key for BTC now to hold this breakout and maintain its low timeframe bullish market structure,” Daan Crypto Trades said, calling the current trading zone “important.”
Separately, Exitpump pointed to a zone rather than a single number, warning followers to keep an eye on $62,000–$62,500 as a “strong resistance area.” The implication for traders is that a move into this band could trigger either consolidation or renewed bids—depending on how Bitcoin reacts as the chart approaches the 200-week line.
The current dynamic also fits the way some traders describe order flow during breakouts. Exitpump referenced “controlled slow buying” on exchanges, suggesting demand is present but not necessarily in a single aggressive surge. If that pattern continues, it may support the idea of gradual progress; if it stops, resistance in the same region could slow the move.
Risk-on tone as equities hit new records
Bitcoin’s strength has coincided with a broadly constructive macro backdrop. With US markets closed for the Independence Day holiday, global equities were still moving higher; the Dow Jones closed at record highs the previous day, and a report cited by The Kobeissi Letter described global market capitalization reaching all-time highs as well.
In a post on X, The Kobeissi Letter wrote: “Global equities are in the midst of one of the most powerful rallies in history.” That kind of parallel move matters for crypto traders because it can influence how investors position across risk assets, especially when interest-rate expectations are in flux.
While Bitcoin is not a direct proxy for stocks, the correlation often becomes more visible when markets treat macro news as broadly supportive for risk appetite. In that setting, technical levels can attract attention faster—particularly when liquidity and sentiment align.
Fed rate pressure eases as jobs data cools expectations
Beyond the charts, the macro driver most directly referenced in the coverage is the impact of recent US labor market data. Earlier coverage linked Bitcoin’s rebound to weak nonfarm payrolls figures, and Mosaic Asset Company argued that the “knee-jerk” response from investors was to lift stock index futures—signaling a regime where weaker economic news supports risk assets by easing rate outlook concerns.
For crypto, the direction of Federal Reserve policy expectations remains one of the key variables. Rate hikes can weigh on liquidity and risk appetite, while expectations of a pause—or slower tightening—tend to improve the backdrop for speculative assets.
To quantify that shifting expectation, CME Group’s FedWatch Tool showed roughly equal odds of a pause or hike at the Fed’s September meeting. The tool also indicated that rates are expected to remain at current levels until that point, leaving September as the next major event for traders to anchor their positioning.
Mosaic’s analysis characterized the payrolls release as closer to a “Goldilocks” outcome—neither weak enough to intensify recession fears nor strong enough to accelerate expectations for additional rate hikes. The central takeaway is that the jobs data may not have changed the overall direction of the policy debate, but it has helped reduce the urgency of the most hawkish interpretation.
That balance can be important for Bitcoin because it supports a middle ground: neither a sharp risk-off shock nor a fully risk-on blowout. Instead, it can create the conditions for measured advances toward technical targets—exactly the type of behavior traders described when they discussed gradual buying and respect for nearby resistance.
What to watch next around the resistance band
Bitcoin is currently pressing into a region traders describe as both a resistance zone and a potential pivot tied to the 200-week moving average. The next meaningful signals will likely come from whether BTC can hold above the $62,000–$62,500 area and, crucially, how it behaves as the weekly candle approaches the 200-week SMA near $62,652.
With the FedWatch probabilities pointing to an evenly split September outcome, markets may remain sensitive to fresh US data releases and incremental shifts in rate expectations—so traders should monitor both technical follow-through and any new developments that could tilt the rate outlook back toward hikes or further toward a pause.