
Bitcoin recently formed a classic double bottom pattern over the weekend, signaling a potential bullish shift in sentiment. The cryptocurrency closed the week above its key 50-week moving average, suggesting growing confidence among investors. While technical signals point toward a continued upward trend, on-chain data and short-term market factors indicate areas of caution that traders should watch closely.
- The Bitcoin double bottom pattern could propel prices toward $110,000 if bullish momentum persists.
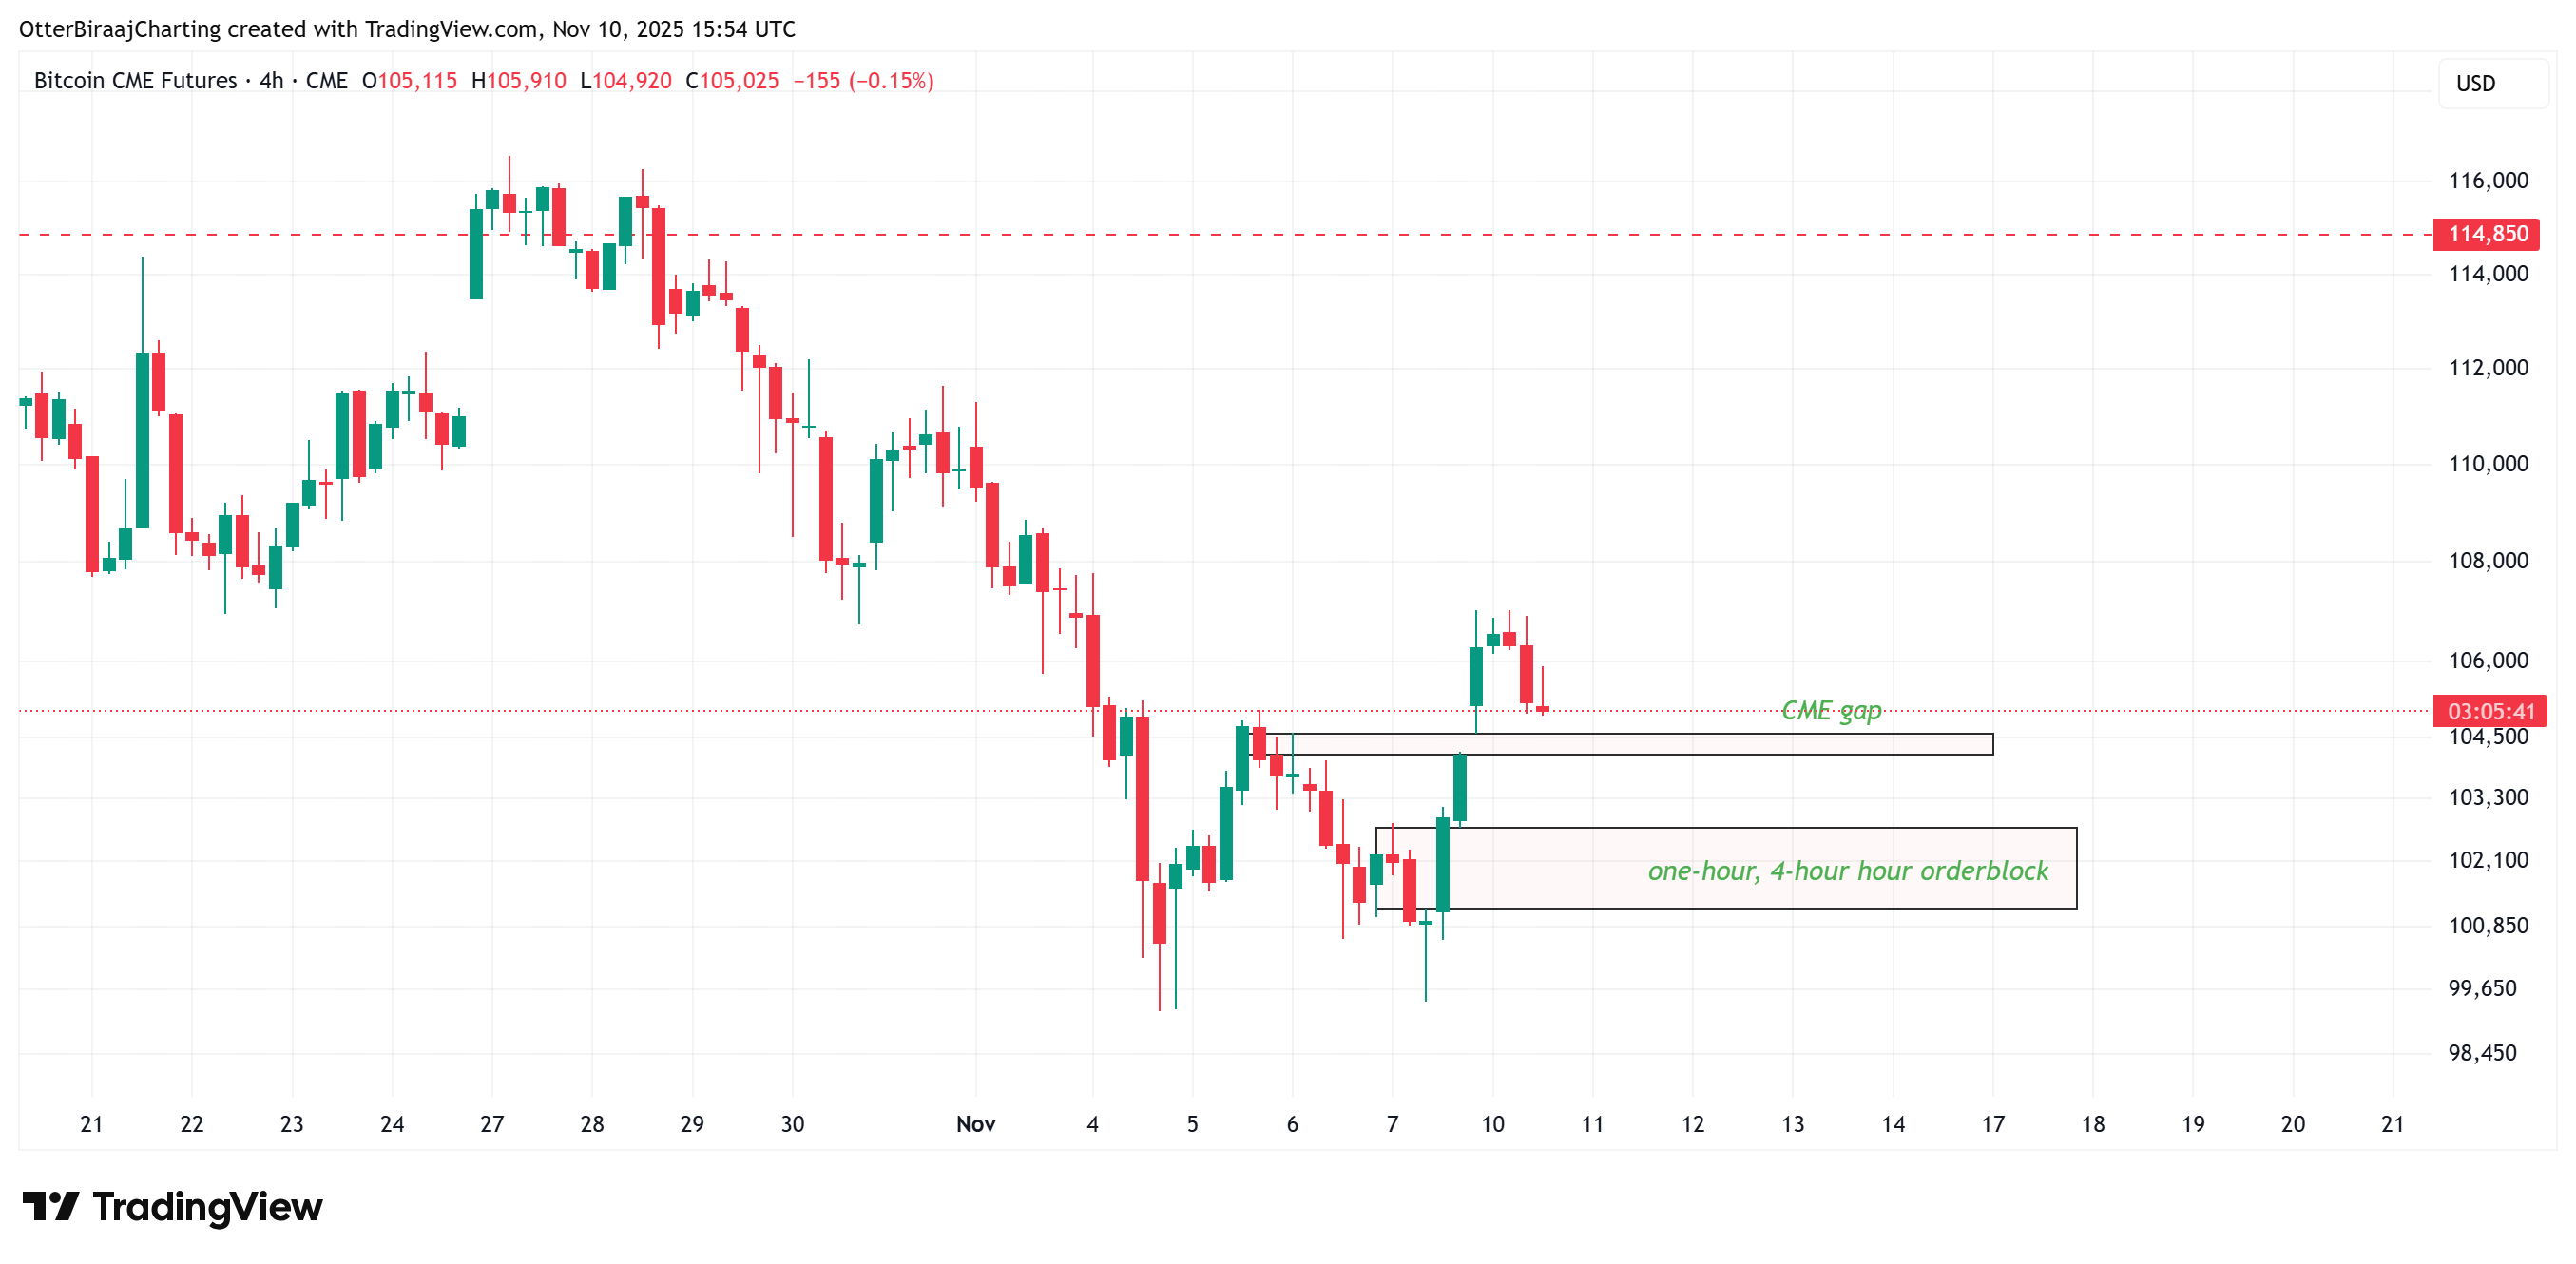
- A pending CME gap near $104,000 may lead to short-term retracement before further gains.
- Rising stablecoin reserves indicate offchain liquidity build-up, potentially fueling future rally attempts.
- Increasing stress among short-term holders hints at near-term volatility in the crypto markets.
Bitcoin (BTC) confirmed a textbook double bottom over the weekend, leading to a weekly close above its 50-week moving average — a significant bullish indicator. The pattern aligns with a region of previous support, specifically the daily order block between $98,100 and $102,000, where BTC repeatedly tested the $100,000 mark before bouncing higher.
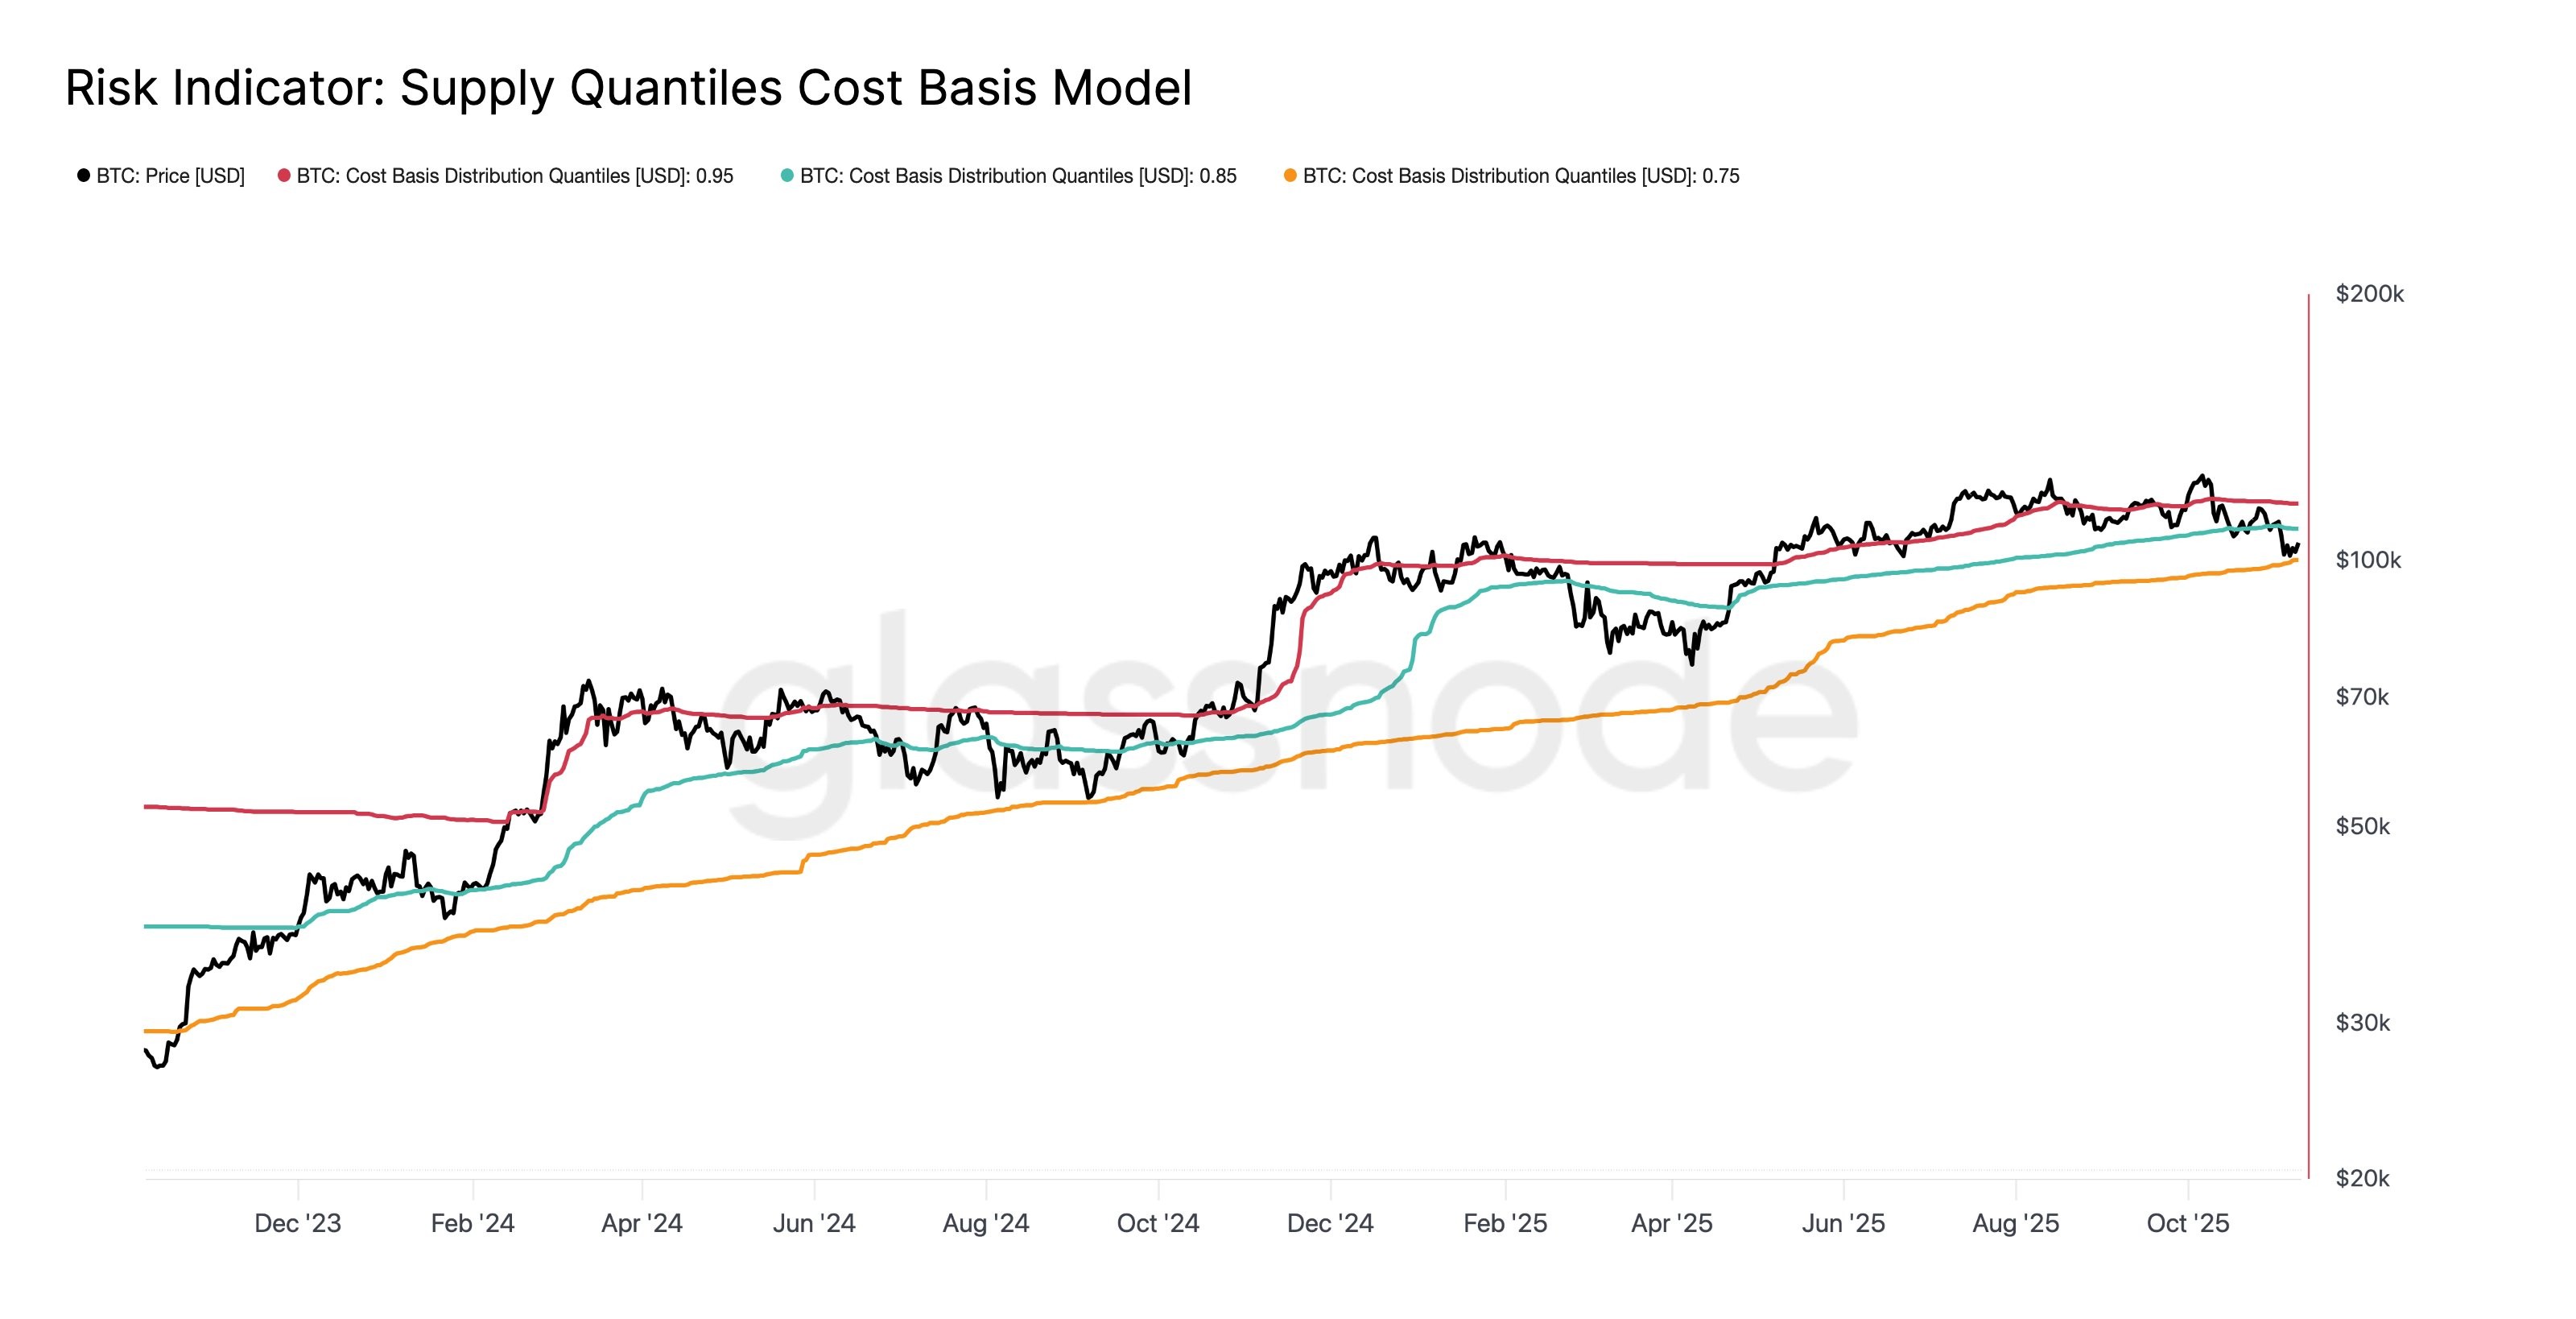
Following a bullish break of structure on the four-hour timeframe, Bitcoin now faces resistance near $111,300. If momentum sustains, this level could be tested. However, on-chain analytics suggest that upward movement may encounter hurdles. According to Glassnode, BTC recently rebounded from the 75th percentile cost basis around $100,000. The next significant resistance lies near the 85th percentile, roughly $108,500, a barrier that has historically tested recovery moves, as it represents the average price at which most investors bought their holdings.
Nevertheless, major resistance looms at around $115,000, as indicated by potential liquidity accumulation, corresponding with a daily resistance point. Furthermore, a notable CME futures gap exists between $103,100 and $104,000. Such gaps often serve as magnets for traders to revisit these levels, which could lead to a short-term retracement before Bitcoin resumes its upward trajectory.
With liquidity précising in the markets and buy-side participation thinning, BTC could decline to revisit levels between $101,000 and $102,500, thereby testing recent order blocks before potentially resuming its bullish climb.
Stablecoin Reserves and Short-term Holder Behavior Impact Market Outlook
Data from CryptoQuant indicates that the Stablecoin Supply Ratio (SSR) has tumbled from over 18 earlier this year to just 13.1 — one of the lowest levels in 2025 — signaling increased offchain liquidity buildup. This suggests that investors are quietly accumulating stablecoins, waiting for clearer market signals before deploying capital into crypto assets.
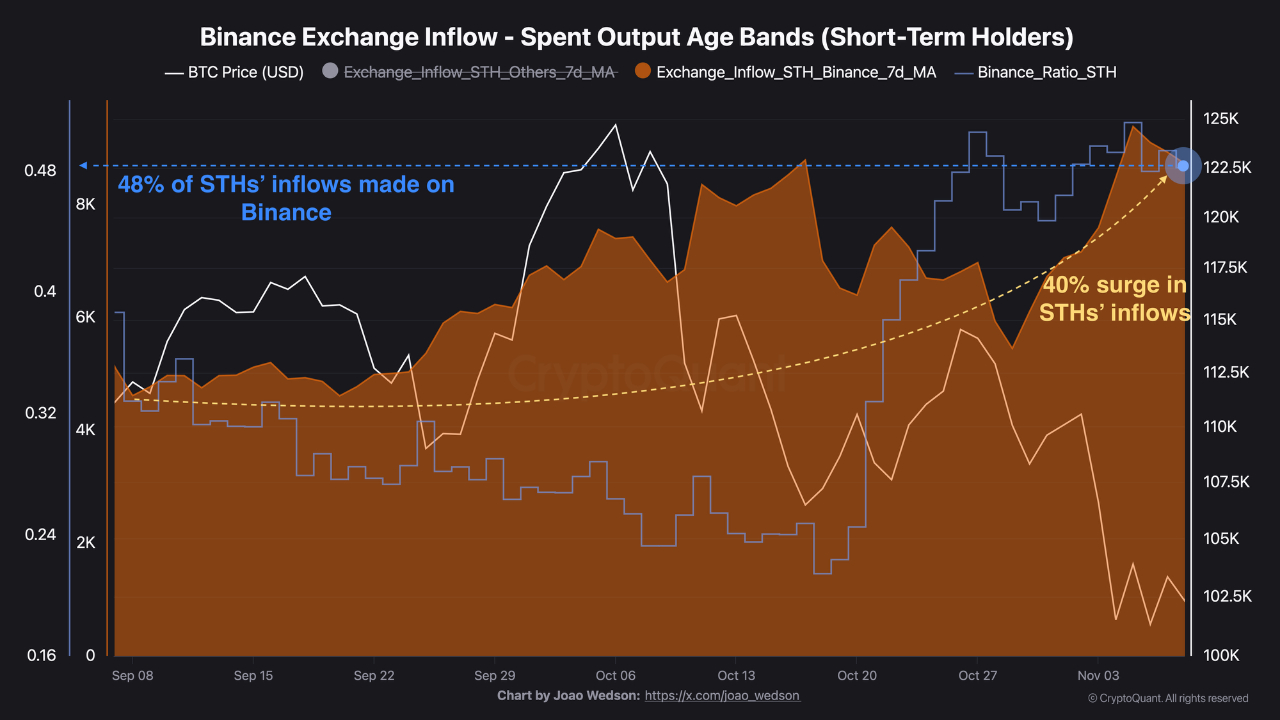
Meanwhile, crypto analyst Darkfost highlighted a sharp 40% increase in short-term holder (STH) inflows to Binance since September, rising from 5,000 BTC to 8,700 BTC. With the average purchase price for STHs near $112,000, many of these investors are currently underwater. Such short-term investors tend to act defensively in volatile environments, and their heightened selling pressure may precede further price corrections, adding a layer of near-term uncertainty to Bitcoin’s outlook.
Overall, while technical indicators project potential for continued bullishness in the crypto markets, traders should remain cautious amid on-chain signals of resistance and short-term profit-taking. As the market navigates these nuanced signals, the coming weeks could bring further volatility and strategic opportunities for investors tracking the evolving cryptocurrency landscape.


