
Bitcoin’s latest price movement signals a potential shift in its long-term trend, with the cryptocurrency dropping below significant support levels and raising concerns of a broader correction. As Bitcoin risks losing momentum that has sustained its bullish run since 2021, traders and investors are closely watching key technical indicators and market sentiment to gauge the next move.
- Bitcoin has fallen below its June support level of $98,000, indicating a possible trend reversal.
- The digital asset faces its first weekly close below the 50-week SMA since 2023, breaking a two-year uptrend.
- All major short-term realized price bands have now flipped into resistance levels.
- Short-term holders are experiencing capitulation losses of nearly 13%, signaling increased market stress.
- Market analysts highlight a critical support zone around the $94,000 mark, which could stabilize or accelerate losses depending on movement.
After defending the 50-week simple moving average (SMA) last week with a robust weekend rebound, Bitcoin is now approaching a critical juncture. Unless the price recovers above $101,000 by Sunday, it may close below this key indicator, further jeopardizing its two-year upward trajectory.
This support level, active since September 2023, has been pivotal in maintaining Bitcoin’s broader bullish outlook. A weekly close beneath it would invalidate the long-standing trend and suggest weakening bullish momentum, possibly leading to a deeper correction.
Bitcoin researcher Axel Adler Jr. emphasized the gravity of the breakdown, stating, “there is no support left in the market, all key metrics have flipped into resistance,” after the asset lost $100,000 on Nov. 14. The breakdown reflects widespread technical erosion and shifting market dynamics.
Data on short-term realized price bands reveal deteriorating support zones. Notably, the 1-week to 1-month realized price at around $102,400 and the 1-month to 3-month band near $98,000 have become overhead hurdles following over $1.1 billion in liquidations, indicating heightened selling pressure.
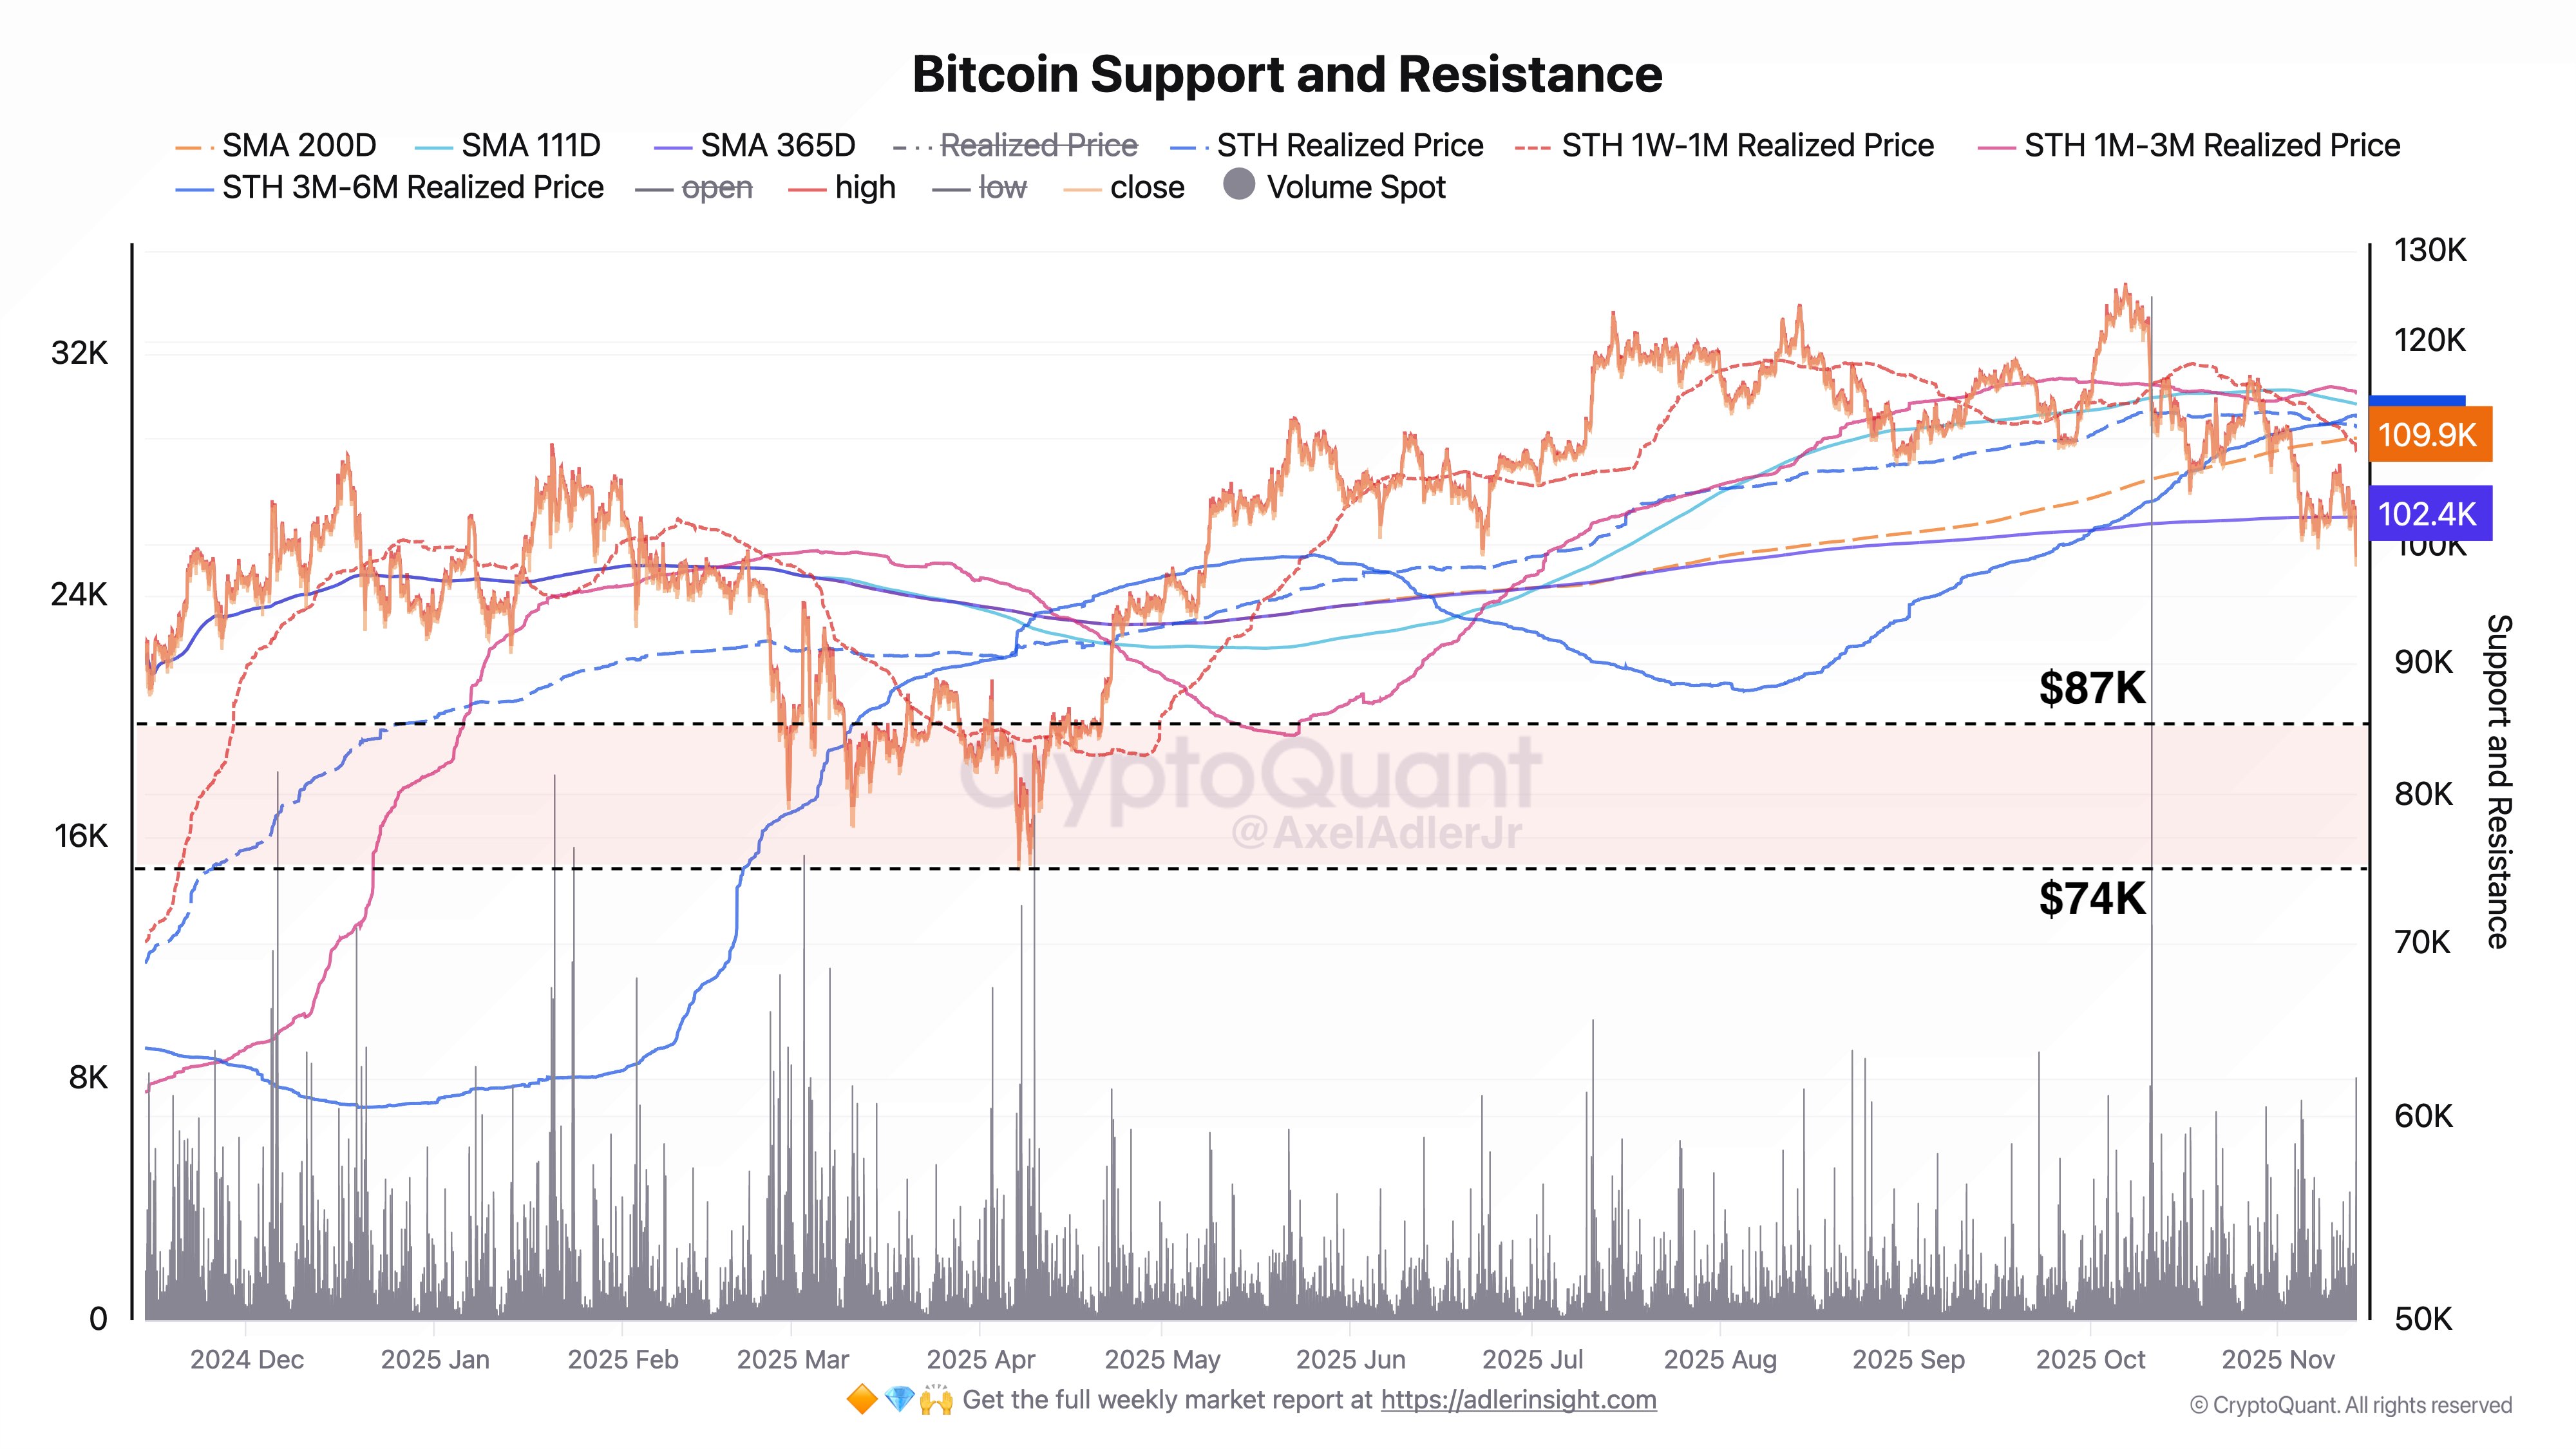
However, some analysts, like CryptoQuant CEO Ki-Young Ju, suggest that a stabilizing support could be near $94,000, aligned with the cost basis of six-to-12-month holders. A bounce from this zone might offer technical relief, but a sustained drop below it could accelerate losses and reinforce a bear market trend.
Market stress indicators show that the recent decline has heightened panic among new and short-term investors. CryptoQuant data highlights that investors who bought Bitcoin in the past six months are now facing an average loss of 12.79%, a typical sign of capitulation. This phase often signals the final flush of weak hands before a potential recovery begins.
Despite the recent turbulence, some analysts maintain a cautiously optimistic view, suggesting that this capitulation could clear the way for long-term holders and eventual stabilization. Yet, caution remains warranted, as technical and on-chain signals point toward increased downside risk in the short run.
This evolving market environment underscores the importance of monitoring key support levels and technical indicators as traders assess whether Bitcoin can sustain its recent losses or if further downside is imminent.
This article does not contain investment advice or recommendations. Every investment and trading move involves risk, and readers should conduct their own research when making a decision.


