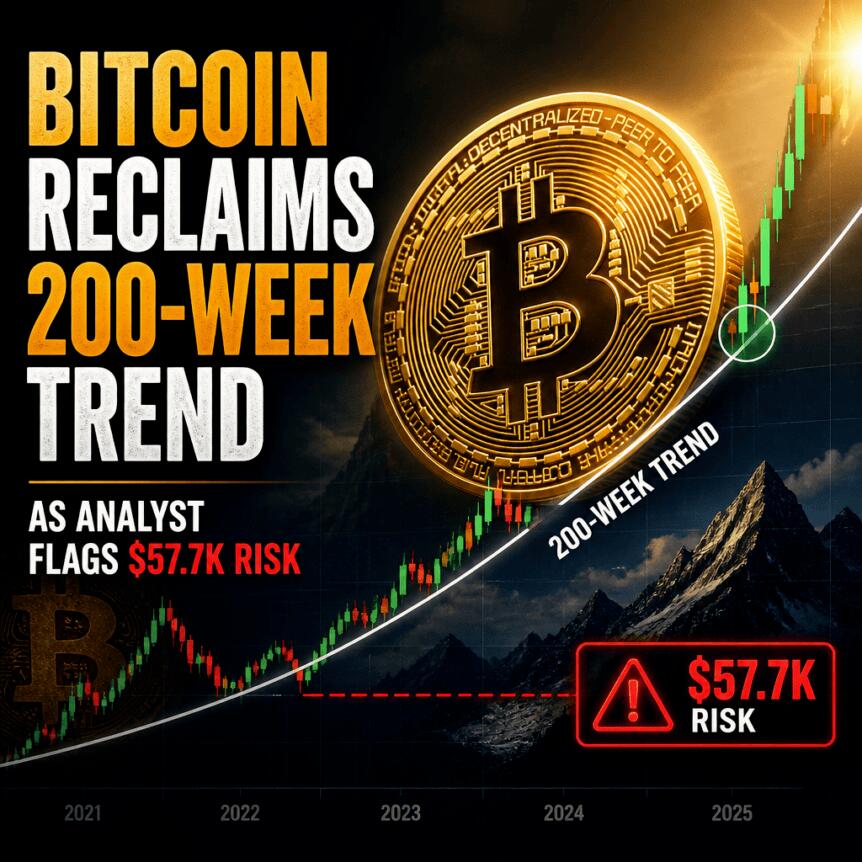
Bitcoin slipped to around $67,500 on Friday, edging below its 200-week simple moving average in what traders described as the first meaningful retest of the long-term trend line in nearly three months. The move has refocused attention on the asset’s larger market structure, with some technical analysts pointing to the possibility of another leg lower if key momentum levels fail.
At the same time, risk sentiment appeared pressured in Asia and US pre-market trading after reports involving Nvidia CEO Jensen Huang and growing uncertainty around leadership. While the connection to crypto is indirect, broader equity weakness and shifting expectations around the AI trade helped set a cautious tone for markets more broadly.
Key takeaways
- Bitcoin dropped to its 200-week simple moving average near $67,993, marking the first test of that weekly trend line in about 11 weeks.
- Material Indicators co-founder Keith Alan said a weekly RSI break below 41.5 could open the door to a move toward a $57,700 cycle low.
- Weekly RSI has reportedly returned to the 41.5 area after previously establishing it as support in late July.
- Asian equities and Nasdaq-100 futures weakened following developments and controversy surrounding Nvidia CEO Jensen Huang.
Bitcoin’s first major retest of the 200-week trend line
According to TradingView data cited in the report, Bitcoin last touched its 200-week simple moving average on Aug. 19. This Friday’s move brought BTC back to that same benchmark—at roughly $67,993—after weeks of trading above it.
The 200-week SMA is often treated by analysts as a major regime indicator for Bitcoin. Historically, it has acted as a reference point during bear-market phases, functioning as either support or resistance depending on the broader trend. The article notes that BTC spent time trading around this average during two distinct stretches in 2023—between March and October—and then again between June and mid-August this year.
Just as important for traders, the report highlights that decisive weekly closes back above the 200-week SMA have previously preceded sharper rallies. That history makes Friday’s dip under the line—especially during the first test after a long absence—feel like more than routine volatility for long-term technical watchers.
RSI level in focus: Alan flags $57,700 if 41.5 breaks
Keith Alan, co-founder of the crypto trading platform Material Indicators, drew a direct link between the 200-week SMA test and momentum measured by the relative strength index (RSI). In his view, the 200-week moving average aligns with a level on the RSI that has meaning for Bitcoin’s cycle behavior.
Alan pointed out that weekly RSI has returned to 41.5, a zone the metric reportedly established as support in late July after several weeks of attempts to break out. In an X post on Friday, Alan wrote that losing 41.5 on weekly RSI would “open the door” to a test of the cycle low near $57.7k. He also suggested that holding the support zone would be bullish—an implication that matters because it frames the current decline as conditional rather than definitive.
For investors and traders, the practical takeaway is that the technical picture is being judged not solely by price relative to the 200-week SMA, but also by whether momentum confirms the move. A failure to hold the RSI level would signal weakening that could make the SMA retest less likely to be a turning point.
Risk sentiment softens as Nvidia leadership controversy spills into markets
Bitcoin’s downside accelerated on Friday as Asian markets reacted to developments around Nvidia CEO Jensen Huang and the controversy surrounding his resignation and related reports. The report states that Hong Kong’s Hang Seng fell 1.55% on the day, while South Korea’s KOSPI Composite Index ended down 0.98%.
In the US, Nasdaq-100 futures reportedly fell slightly, with the Nasdaq 100 down about 0.2%. The framing in the report suggests investors were watching whether capital might rotate into other advanced chip design companies—an effort to preserve the broader “AI trade” even as attention turns away from Nvidia.
Mark Franklin, head of multi-asset solutions for Asia at Manulife Investment Management, told CNBC that markets were showing “a bit of a rotation” into other advanced chip design firms on the assumption that this could help other companies catch up. While that explanation is grounded in equity market logic, the ripple effect matters for crypto because BTC often trades as a high-beta asset during periods when global risk appetite shifts.
The report also notes that Nvidia stock was reportedly up slightly in pre-market trading, alongside reports of growing support for Huang’s return. Separately, an internal post quoted by Wired reportedly drew more than 1,600 comments from employees, reflecting continued debate inside the company. Even when these developments do not directly involve crypto, they can influence the broader liquidity and sentiment environment that traders respond to day-to-day.
What to watch next: whether the RSI failure becomes trend
The immediate question for Bitcoin is whether Friday’s interaction with the 200-week SMA becomes a shallow rejection or a step toward the next downside test. If weekly RSI indeed breaks below 41.5 as Alan suggests, the market may start pricing a deeper move toward the cited $57.7k cycle low. If, instead, momentum stabilizes and the RSI support holds, the 200-week SMA retest could remain a temporary pause within a wider structure.