
Bitcoin’s recent price movements reflect an ongoing tug-of-war between bullish structures and bearish technical signals, amid broader macroeconomic influences. After a brief attempt at recovery spurred by Nvidia’s strong earnings, crypto markets experienced renewed volatility, with Bitcoin dipping below key support levels. As traders assess potential future paths, market analysts highlight possible consolidation phases and bearish scenarios that could lead to significant drops, emphasizing the importance of technical patterns and macroeconomic factors in the current cryptocurrency climate.
- Bitcoin shows signs of a potential consolidation phase between $85,000 and $100,000, mirroring a bullish reversal fractal from Q1 2025.
- An oversold weekly RSI and technical patterns suggest Bitcoin could find local support before retesting higher resistance levels.
- Some analysts warn of a possible breakdown from a rising wedge pattern, projecting a long-term target near $30,000.
- Market reactions continue to be influenced by broader macroeconomic fears, including concerns over a potential AI-driven market bubble.
Bitcoin mirrors Q1’s bullish reversal fractal: Analyst
Bitcoin’s recent price decline appears to replicate the bullish reversal pattern observed earlier in the year, according to crypto analyst Cas Abbé. During that previous cycle, BTC lost momentum near its all-time high, slipped below crucial support, and decoupled from a rising stock market, eventually entering a protracted accumulation range before resuming its rally.
Abbé’s chart below illustrates how the current price action closely resembles those past movements, suggesting that Bitcoin could remain in a consolidation zone between $85,000 and $100,000 for the next three to four weeks.
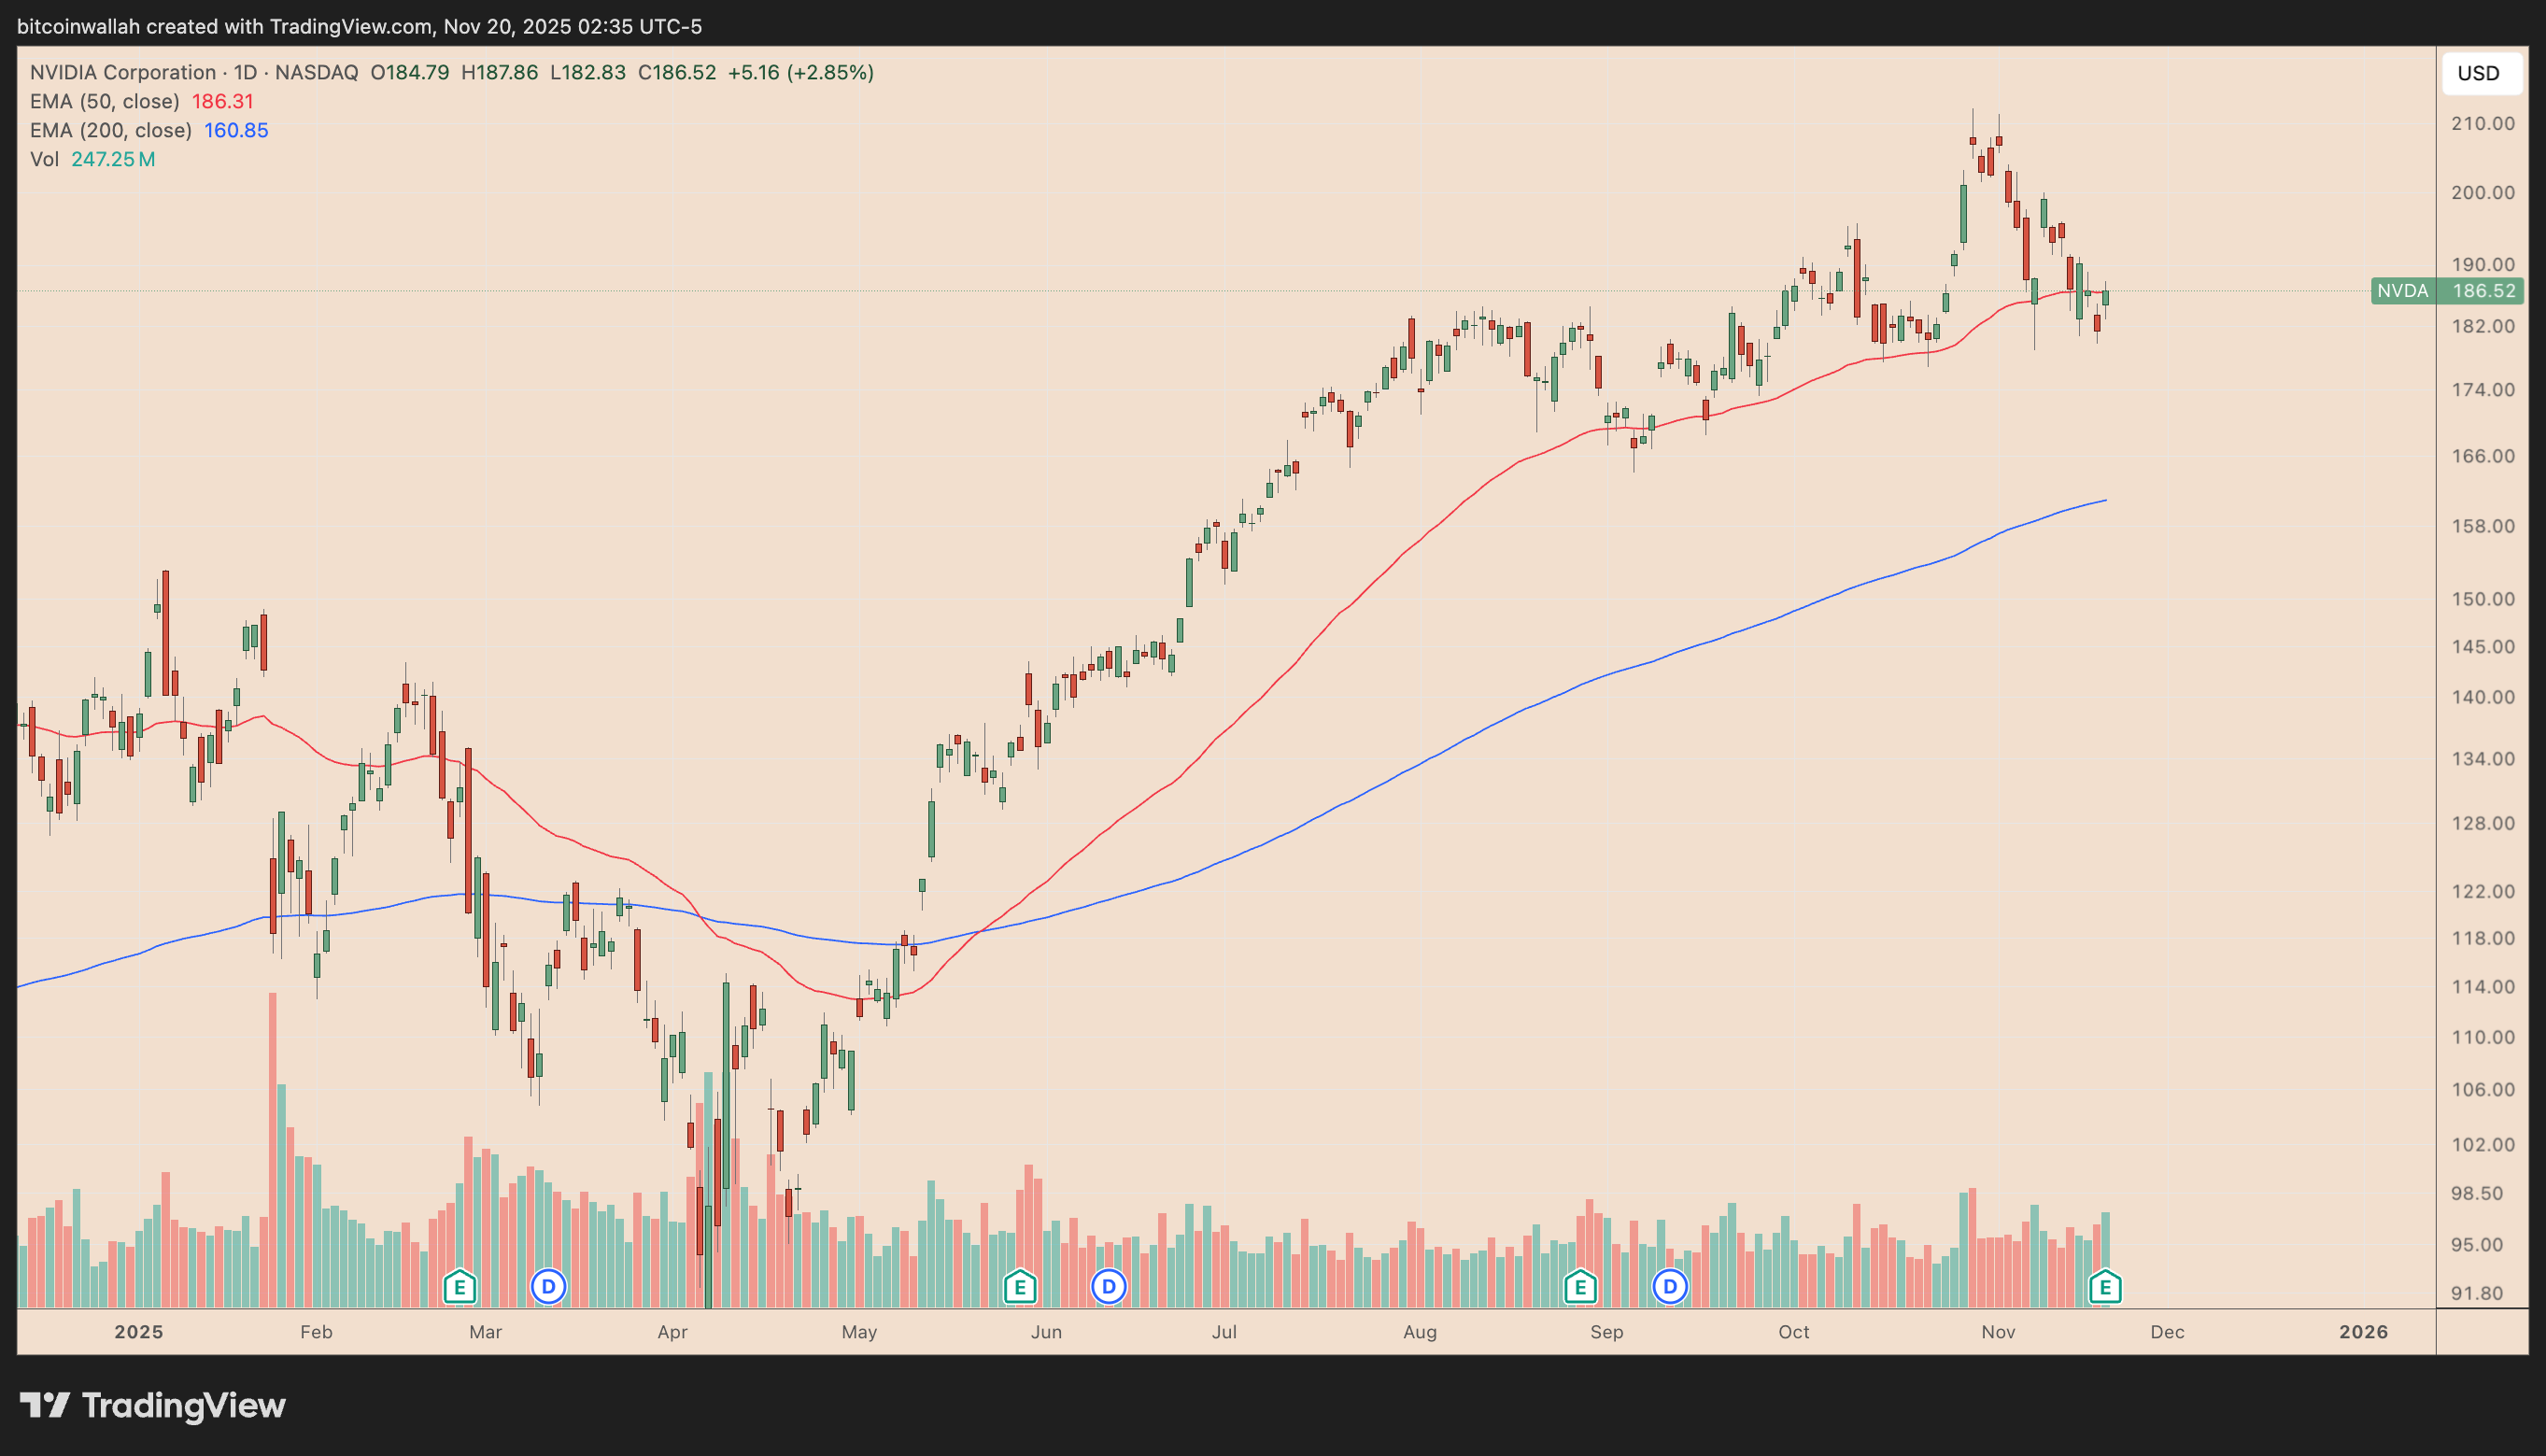
Both periods were driven by macroeconomic fears—initially the US trade war, now concerns over an AI bubble—highlighting how external factors heavily influence crypto markets. Nvidia’s bullish revenue outlook temporarily eased market fears, but the broader sell-off persisted.
This fractal pattern indicates a higher probability of Bitcoin retesting $100,000 resistance before a potential correction, especially given technical cues like oversold conditions and support levels.
Analyst BitBull reinforces this view, citing Bitcoin’s deeply oversold status and technical structure within a descending channel. He notes the current price near the lower boundary of this downtrend signals a possible local bottom, with a potential rally toward $98,000 to $100,000.
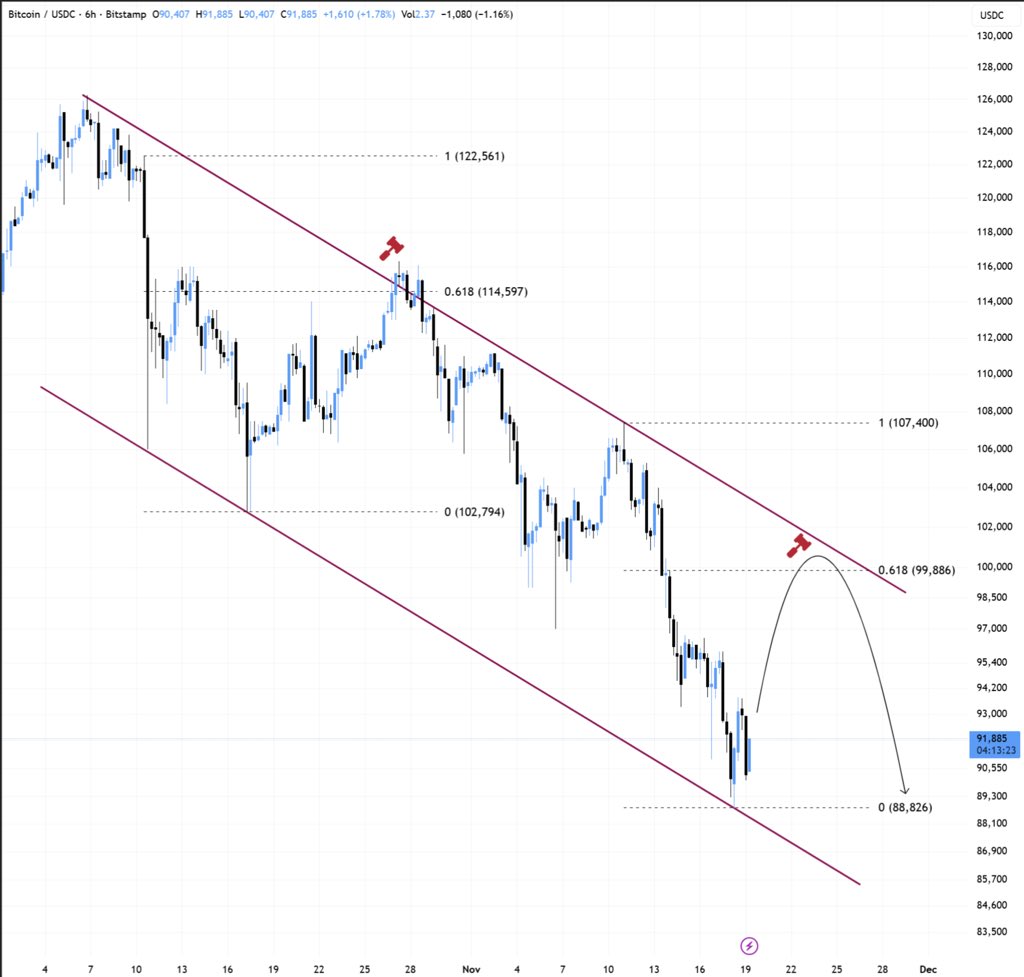
Further supporting the near-term bullish case, Bitcoin’s weekly relative strength index (RSI) has dipped into oversold territory for the first time in months, suggesting potential for a bounce before any deeper corrections.
Related: $90K Bitcoin price is a ‘close your eyes and bid’ opportunity: Analyst
Overall, these technical signals imply Bitcoin could see a short-term rally, but caution remains with broader macroeconomic fears still looming large.
Rising wedge breakdown flags $30,000 BTC price target
However, not all analysts are optimistic. Crypto strategist AlejandroBTC warns that Bitcoin has broken down from a long-term rising wedge pattern—often viewed as a bearish signal—and projects a potential decline toward $30,000. This pattern’s measured move suggests a significant trend reversal if confirmed.
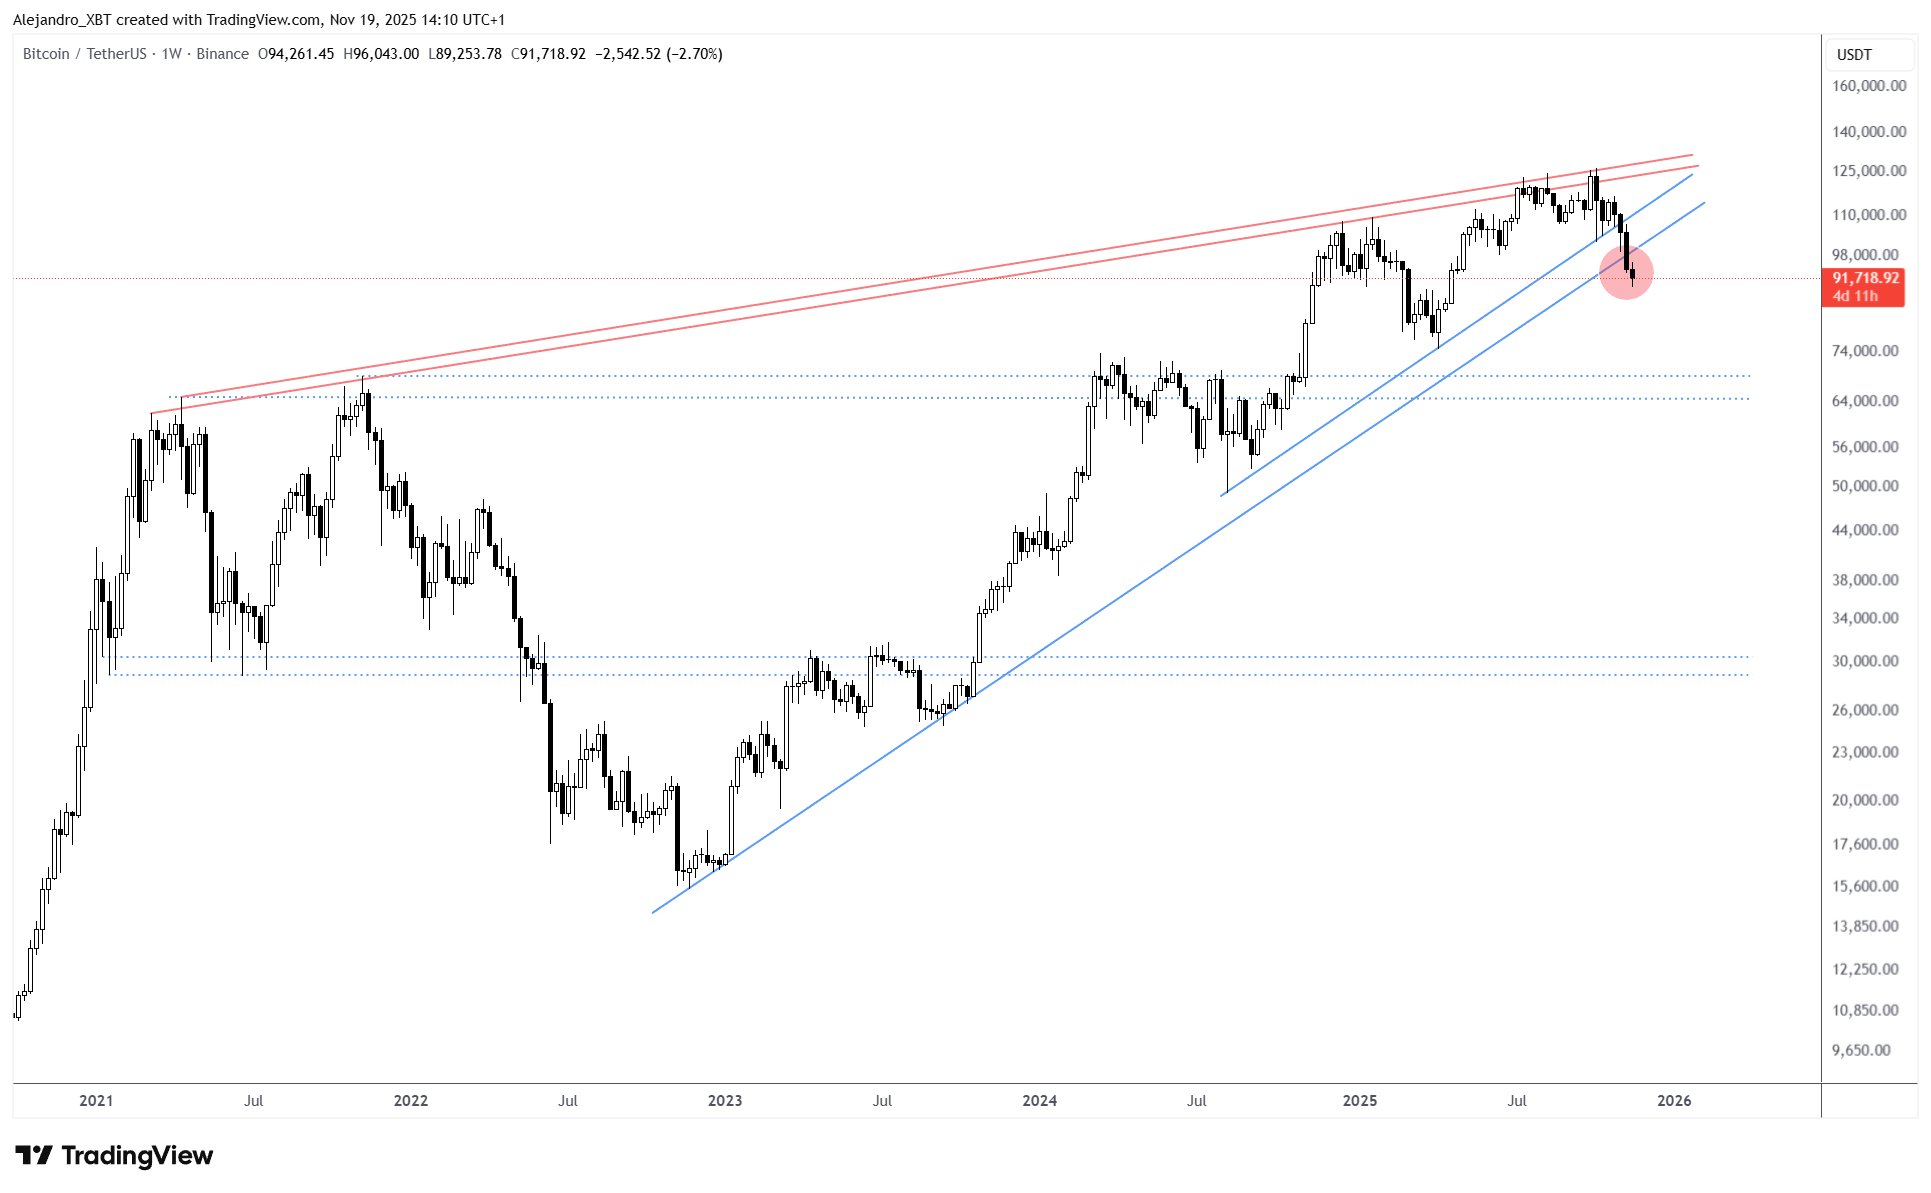
In this scenario, the long-term target aligns with historical support zones on Bitcoin’s weekly chart, emphasizing the possibility of a deep correction amid ongoing macroeconomic uncertainties. Such a decline would have profound implications for the cryptocurrency markets, highlighting the importance of technical analysis in predicting potential downside risks.
This article does not constitute financial advice. Trading cryptocurrencies involves risks, and investors should perform thorough due diligence before making decisions.


