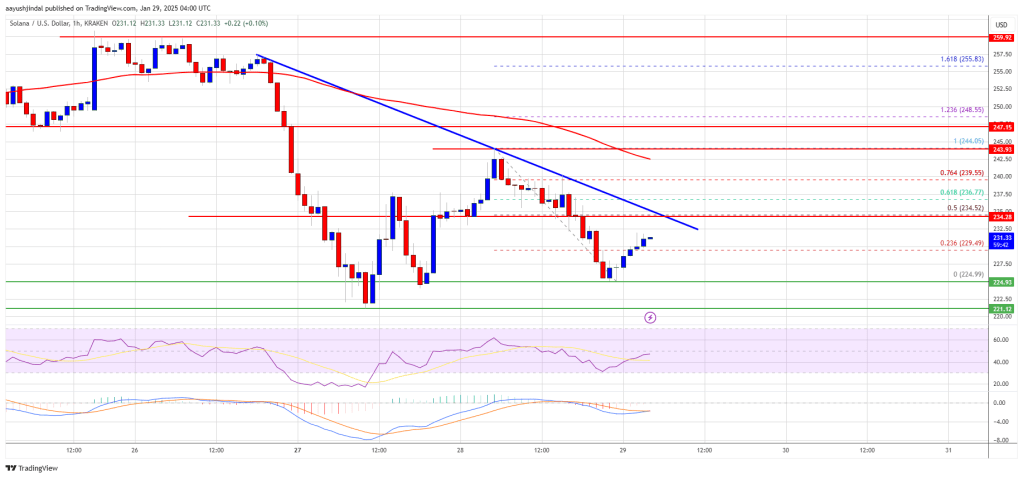
Solana initiates a new downward trend falling below the $250 support level. SOL’s price is currently consolidating and could encounter resistance around the $235 and $242 marks.
- The SOL price has commenced a fresh decline below both the $250 and $240 levels against the US Dollar.
- Currently, the price is trading under $240 and under the 100-hourly simple moving average.
- An important bearish trend line is emerging with resistance at $235 on the hourly chart of the SOL/USD pair (data provided by Kraken).
- If bulls manage to surpass the $242 zone, the pair may see a new uptrend.
Solana’s Price Dips Below the $250 Mark
Solana’s price struggled to surpass the $260 resistance level and instead began a new decline, similar to Bitcoin and Ethereum. SOL’s value dropped below the $250 and $242 support thresholds.
The price even fell below $230. A recent low was established at $225, and now the price is consolidating its losses. It showed some upward movement past the $230 mark, surpassing the 23.6% Fib retracement level from the drop between the $244 high and $225 low.
At present, Solana is trading below $240 and the 100-hourly simple moving average. On the upside, resistance is being encountered near the $235 level or the 50% Fib retracement level from the downswing between the $244 high and $225 low.
Additionally, there is a significant bearish trend line with resistance at $235 on the hourly SOL/USD chart. The next major resistance is likely around the $242 level, with $250 being the main resistance level. A successful breach of the $250 resistance zone could pave the way for further gains, with the next key resistance sitting at $260. Continued upward momentum could push the price towards the $275 level.
Potential for Another Decline in SOL?
If SOL is unable to break through the $235 resistance, it may start another downtrend. Initial support on the downside can be found near the $225 mark, followed by a major support level near $222.
A drop beneath the $222 level might drive the price towards the $212 area. A close below the $212 support could lead to a decline towards the $200 support in the short term.
Technical Indicators
Hourly MACD – The MACD for SOL/USD is indicating a slowdown in the bullish trend.
Hourly RSI (Relative Strength Index) – The RSI for SOL/USD is currently below the 50 level.
Key Support Levels – $225 and $222.
Key Resistance Levels – $235 and $242.


