Approaching Key Trendline Convergence for Shib
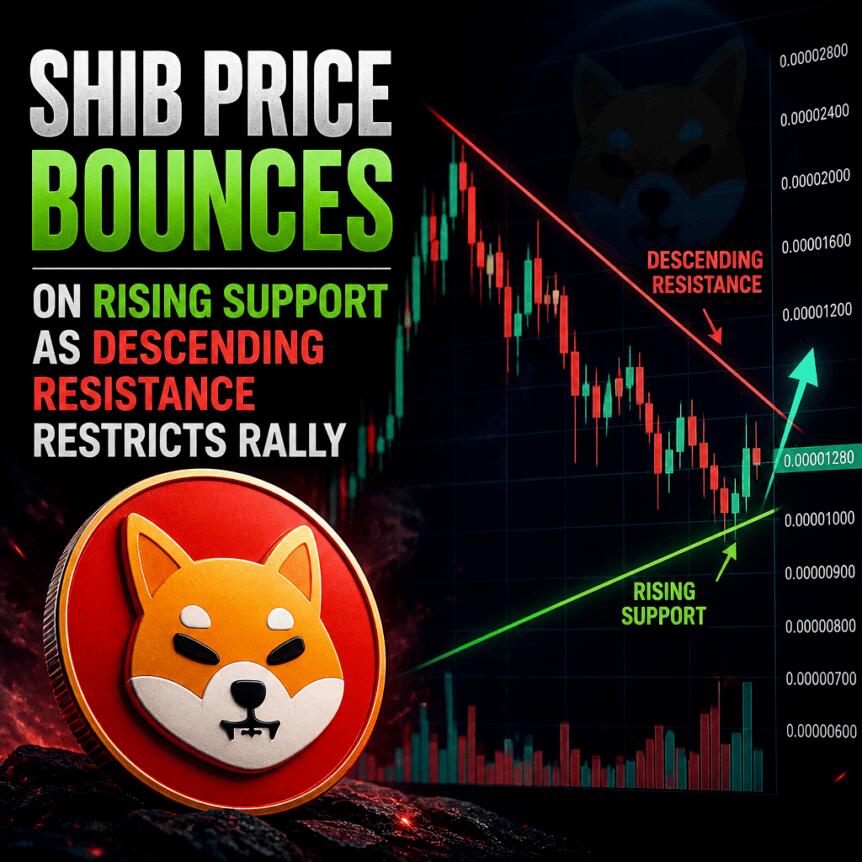
SHIB has reached a key technical point where support moves up and resistance moves down, creating a setup indicating price consolidation. However, neither buyers nor sellers have provided an indication about which way the price will move.
In a chart shown by Terrarmy on X, the daily timeframe shows that the price is consolidating between the rising red support line and the descending yellow resistance line. This technical setup indicates a bounce after a period of decline during July, from lows of $0.0000035 to rally in August to highs of $0.00000620.
From there, SHIB failed to move up as it has been capped by the upper boundary. However, the rising support line means that the buyers have defended higher lows over time. A breach of the support line could signal a reversal of the rally.
Price Appreciation Comes Hand in Hand With Reduced Trading Volume
SHIB was traded at $0.000005448, appreciating by 2.03% within 24 hours. The intraday prices appreciated between $0.00000536 and $0.00000550, with buyers pushing the price higher before a slight retracement.
Although the price appreciates, there has been a reduction in the trading volume by 31.24%. This makes one wonder if there is participation in the upsurge, but a reduced volume does not always mean that there is a lack of buying pressure.
It could be a situation where traders are consolidating as they wait for a signal before acting again. Hence, the combination of price appreciating beyond the resistance level with volume appreciation would be more convincing.
In the same way, volume explosions show that there is more activity in the market, but abnormal volumes in historical charts need to be verified first.
Shib Resistance Levels and Support Levels Influence the Forecast
Resistance at $0.00000620 continues to be a major impediment to SHIB’s rise. The cryptocurrency has managed to test this level without forming a convincing breakout.
A daily close above this resistance level, accompanied by higher volumes, would be a positive sign. A violation of the downward resistance would suggest that buyers have resumed control over the price action.
But a lack of an ability to violate the resistance level would mean that the asset stays within its decreasing range. A breakdown below the ascending support line would damage the recovery pattern and would lead to a focus on the support levels of $0.0000050 and $0.0000045.
This is only a possible target for SHIB rather than a price floor, which depends on market situation and the activity of traders.
The total number of holders of $3.09 million and market capitalization of approximately $3.21 billion can be useful information, but it does not determine the next price movement of SHIB.
Market Direction Still Unclear
The technical picture for SHIB still looks indecisive. As support is increasing, it may be interpreted that sellers are defending their ground, but with falling resistance and reduced volume, it’s time to be careful. Any breakout or breakdown needs to be confirmed in order to make a move clear.
Key Highlights
- SHIB rose by 2.03% within 24 hours to touch around $0.000005448, with trading volume dipping by 31.24%.
- The rising support and descending resistance are restricting the SHIB trading range, forming the breakout or breakdown scenario.
- The resistances at $0.00000620 and supports at $0.0000050 and $0.0000045 are key levels.