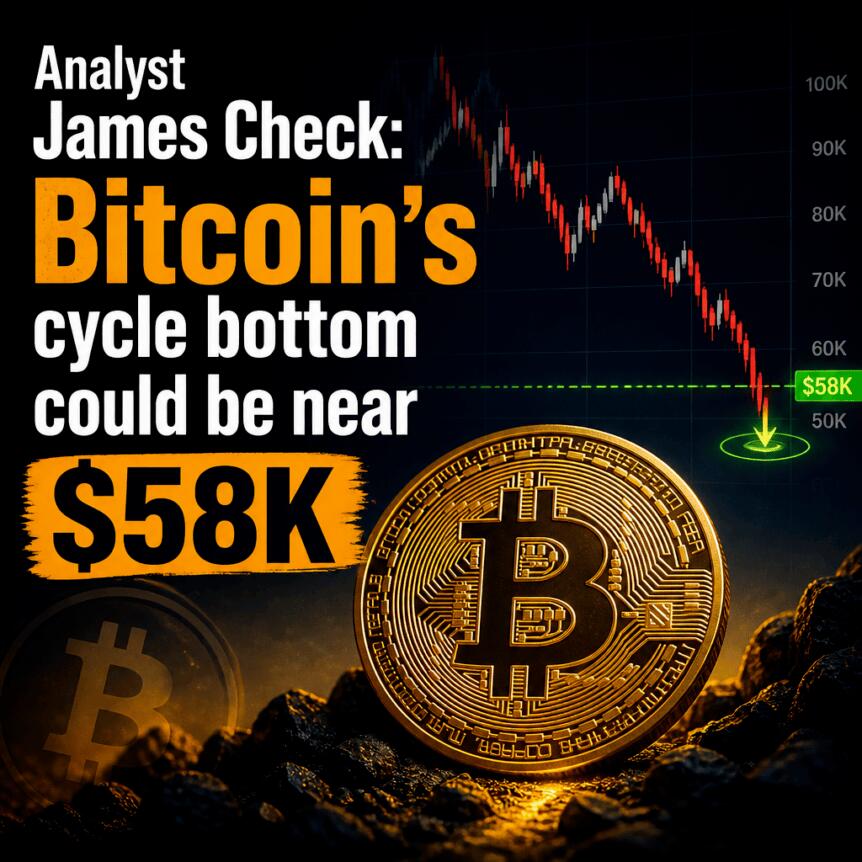
Bitcoin’s next major drawdown narrative is coming into question as on-chain and holder-behavior analysis suggest the market may have already absorbed much of its selling pressure. James Check, founder and lead analyst at Checkonchain, argued that Bitcoin likely formed its cycle bottom after two capitulation-style events rather than waiting for a late-2026 timing window tied to the so-called four-year cycle.
At the time of writing, Bitcoin was trading around $77,400, following a peak of just over $126,000 in October 2025—about 39% below that high. Check’s view challenges expectations that another low is due in October 2026, including earlier calls from analysts who referenced cycle-duration patterns and the US midterm-election calendar.
Key takeaways
- Checkonchain founder James Check said Bitcoin showed “price-pain” and “time-pain” capitulation behavior around the February and June–July drawdowns.
- He argued the market’s cost-basis concentration and holder profitability dynamics indicate selling pressure may have been largely processed earlier than anticipated.
- Check cautioned traders against anchoring decisions to calendar-based four-year cycle timing without accompanying evidence of exhaustion.
- Grayscale research head Zach Pandl similarly suggested a potential bottom near $58,000 at the end of June, citing a relatively contained decline and reduced “bad-news” downside.
- On-chain signals are still mixed: some metrics point to muted dip-buying, while others show short-term holders staying profitable for an extended period.
Capitulation signals appear earlier than cycle-timing calls
In an interview on Cointelegraph’s Proof of Thesis, James Check described Bitcoin’s February slide toward roughly $60,000 as a “price-pain capitulation.” In his framing, the move reflected investors who bought near prior highs exiting at substantial losses after prices broke down.
Check then identified a second phase of “time-pain capitulation” around approximately $58,000 in June and July. He linked this leg to months of sideways trading that eroded confidence among holders, eventually pushing additional participants to sell rather than wait indefinitely for a rebound.
Importantly, Check argued that the difference between a range like $58,000 and $60,000 is less meaningful than the elapsed time between those levels. He emphasized that the “actual difference” was the six-month separation—suggesting the market experienced a deeper psychological and behavioral reset earlier than many timing models imply.
That view stands in tension with expectations some traders hold regarding an October low based on recurring four-year cycle patterns. Earlier, analyst Benjamin Cowen had pointed to cycle-duration information and the US midterm-election calendar as reasons to anticipate a fourth-quarter bottoming window. Check’s framework effectively says the market may already have completed much of the required capitulation process months before a calendar-driven trough would arrive.
Cost basis and holder behavior: why “selling pressure” may be absorbed
Check claimed that roughly $300 billion in Bitcoin cost basis sat concentrated between $58,000 and $70,000. According to him, around 4 million BTC subsequently moved from unrealized losses into profit during the recovery—an important behavioral milestone because it can alter how investors act.
He also suggested that long-term holders now control about 80% of Bitcoin wealth. In Check’s view, that distribution matters: long-term investors are more likely to wait for substantially higher prices rather than sell after a short-term rebound, which can change the market’s ability to sustain new lows.
Put simply, Check’s argument is that capitulation is not just a price print—it’s a transition in profitability and incentives. When enough coins move from loss to profit and the holder base becomes more stable, the conditions that typically drive further waterfall selling may ease.
Why traders shouldn’t treat the four-year cycle as a rule
Check’s critique went beyond one forecast. He said that anchoring decisions to the four-year cycle is a mistake because there is no mechanical reason for it to repeat.
“Ask, ‘Well, now what do I do?’ long before your compass breaks,” Check said, comparing cycle reliance to a broken clock that is only correct by coincidence. In his view, that mindset encourages traders to look for dates rather than confirm whether capitulation and exhaustion are actually present.
Instead, Check argued traders should evaluate metrics like cost basis distribution, unrealized and realized losses, holder profitability, and whether experienced investors are accumulating or distributing. Calendar dates should only provide context after market evidence indicates exhaustion. “Look for the evidence, not the calendar,” he added.
Grayscale’s Zach Pandl sees a June $58,000 bottom—though data is mixed
Check’s stance aligns with a separate analysis from Grayscale head of research Zach Pandl, who also discussed Bitcoin’s downside trajectory in a recent interview on Cointelegraph’s Trade Secrets. Pandl said he was willing to “stick [his] neck out” and guess that prices bottomed near $58,000 at the end of June.
In his assessment, this bear-market move produced less despair than previous Bitcoin drawdowns, partly because it followed a bull market with less euphoria. Pandl suggested that combination could translate into a more contained decline compared with earlier cycles.
He also pointed to a market behavior test: whether Bitcoin keeps falling after bad news. “When price in an asset class, whether it’s crypto or anything else, stops going down on bad news, that’s usually a sign that it’s oversold,” Pandl said—framing a potential turning point in terms of downside momentum rather than a specific calendar date.
On-chain indicators don’t all agree
Despite the $58,000 bottom thesis, on-chain evidence remains inconsistent across datasets. HODL Waves data showed Bitcoin supply held for one to seven days rose only from 1.97% on July 1 to 2.35% on July 5. Analyst Willy Woo interpreted that as an unusually muted response from dip-buyers, implying limited enthusiasm from short-term participants during that period.
Other analytics point in the opposite direction. CryptoQuant data, as reported by Cointelegraph, showed short-term holders remained partially profitable for 30 consecutive days—described as the longest such stretch in 2026 at the time—alongside a pattern that CryptoQuant said has historically characterized Bitcoin recoveries.
Taken together, the mixed signals suggest that while selling pressure may have eased and profitability dynamics may have improved, participation from new short-term buyers was not uniformly aggressive. That can matter for how quickly liquidity returns and whether any rally can broaden beyond the same cohort of holders.
For investors and traders, the near-term question is less about which date a model prefers and more about whether on-chain profitability transitions continue and whether short-term demand strengthens without relying on calendar coincidences. Monitoring holder cost-basis shifts alongside realized-loss behavior may help clarify whether the market’s “capitulation” phase is truly behind it—or whether another wave of distribution is still possible.