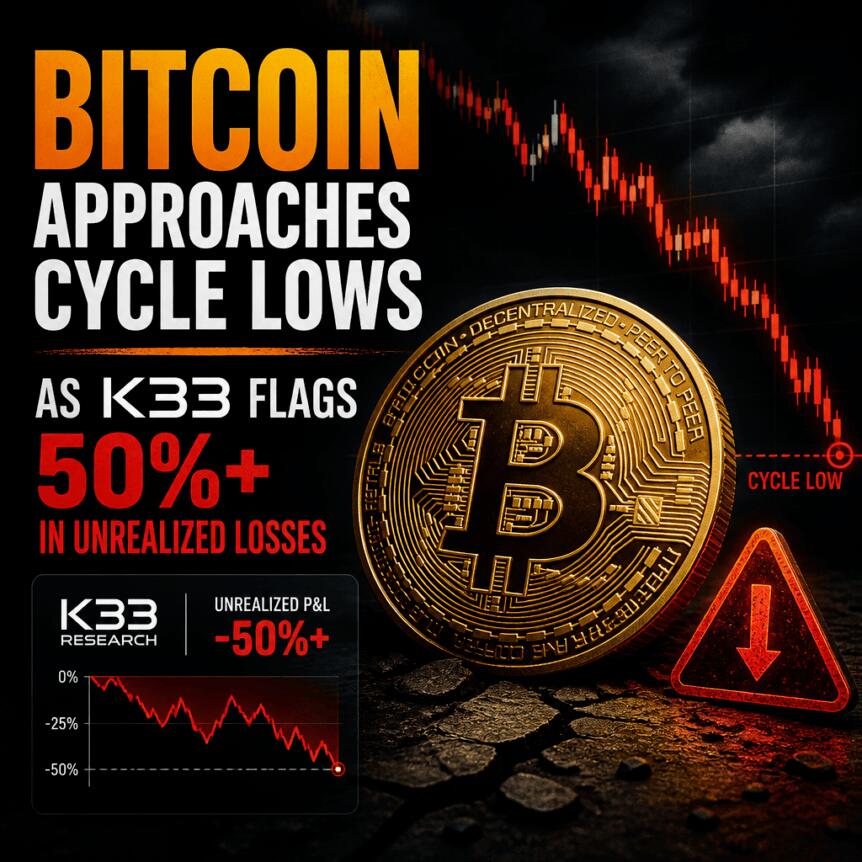
Bitcoin’s “underwater” ratio—the share of circulating supply held at a loss—has climbed above the 50% mark, a threshold that K33 says has often aligned with late-stage bear-market conditions. In its latest research note released Tuesday as part of its H1 2026 roundup, the digital asset brokerage estimated that more than half of all Bitcoin is currently underwater.
K33 also cautioned that this cycle may not mirror prior ones exactly. Because the most recent bull run appeared less extreme than earlier downturn-and-recovery cycles, the firm suggests the drawdown that followed could be comparatively milder. For investors, the key question is what happens after this kind of capitulation-style stress—whether selling pressure truly fades and how quickly “late bear” dynamics translate into renewed risk appetite.
Key takeaways
- Over half of circulating Bitcoin is held at a loss, according to K33—an indicator the firm links to the late stages of bear markets.
- In prior cycles, the sell-off tended to exhaust within weeks of the ratio crossing 50% (with one notable exception in 2014).
- K33 expects this cycle may differ because earlier bull-market extremes were less pronounced this time.
- Spot Bitcoin ETF flows were mixed: two consecutive inflow days followed by record-high June outflows, per Farside Investors data.
- Other gauges point to improving momentum, including Block Scholes’ Risk Appetite Index, which has historically preceded positive 100-day spot returns.
Why the “underwater supply” metric matters
K33’s central observation is straightforward: when a majority of holders are underwater, the market is often closer to the point where forced selling and widespread disillusionment start to ease. Historically, analysts treat the metric as a proxy for the distribution of realized gains and losses across the circulating base—essentially a measure of how much of the ownership is experiencing negative mark-to-market performance.
As K33 framed it in the report, Bitcoin has tended to be in late bear-market phases when more than half of circulating supply is held at a loss. While no single statistic can perfectly time a bottom, the underwater ratio remains popular because it captures a broad ownership reality rather than only short-term price action.
What earlier cycle data suggests about timing
In the report, K33 described how prior bear markets generally bottomed relatively soon after the 50% underwater threshold was reached. The pattern was consistent across multiple cycles:
- 2017 bear market: Bitcoin bottomed 31 days after more than half of supply was held at a loss.
- November 2018: Bitcoin bottomed 23 days after the same condition.
- November 2022: Bitcoin bottomed roughly 13 days after 50%+ supply was underwater.
K33 also highlighted that the 2014 cycle deviated from the pattern. In that earlier period, Bitcoin bottomed 101 days after half the supply was held at a loss, and the asset ended up lower one year after the signal—down about 25%. That outlier matters because it underscores that “underwater majority” can coincide with different macro and liquidity regimes, not just investor psychology.
For current market participants, the most actionable takeaway is not the exact number of days implied by past cycles, but the idea that the 50% threshold has historically marked a phase where the downside momentum has often started to slow. Investors still need to watch whether the current market follows the more typical timing—or whether today’s conditions resemble the 2014-style lag.
ETF flows add a complication to this cycle
K33 flagged that large, structurally different sellers could shift how this cycle behaves compared with earlier ones. Spot Bitcoin exchange-traded funds (ETFs), in particular, can influence price by channeling flows through a regulated wrapper rather than only through traditional trading behavior.
The report pointed to a notable sequence in ETF demand: spot Bitcoin ETFs recorded two consecutive days of inflows, including $265 million on Monday. But according to Farside Investors, those gains were outweighed by $4.51 billion in net outflows in June, which the data described as the worst month on record.
This combination—short bursts of inflow against a still-negative longer trend—can be important for how quickly the market transitions from “stress” to “turn.” Even if the underwater ratio suggests selling pressure may be nearing exhaustion, ETF flow dynamics can reinforce either stabilization or renewed pressure depending on whether June’s outflows continue or reverse.
Risk appetite gauges point to a possible turn
Beyond realized-loss metrics, K33’s report also aligns with other momentum-style indicators. One such tool referenced in the article is Block Scholes’ Risk Appetite Index, which tracks bullish versus bearish momentum across digital assets.
According to the report, Bitcoin’s risk appetite measure fell to -1.27 on July 3 and has since moved higher. Block Scholes tied this kind of rebound to outcomes in past episodes: in the eight prior instances it identified, the median spot return over the subsequent 100 days was 12%.
A Block Scholes spokesperson told Cointelegraph that historically, the move “has preceded a more bullish outperformance in spot prices” and could support additional allocation toward risk assets such as crypto.
What makes this useful for readers is the cross-check. If the underwater ratio is telling you the market is late in the bear phase, and risk appetite is showing an improvement from a low, the combination suggests conditions may be shifting from widespread pain toward more constructive positioning—though it still doesn’t eliminate volatility risk.
What to watch next
With more than half of circulating Bitcoin estimated to be held at a loss, the market is approaching a historically meaningful decision point. Traders and investors should focus on whether ETF flow trends continue to stabilize after June’s record outflows and whether risk appetite measures keep rising—signs that would support a faster transition away from bear-market selling pressure rather than a prolonged, 2014-like lag.